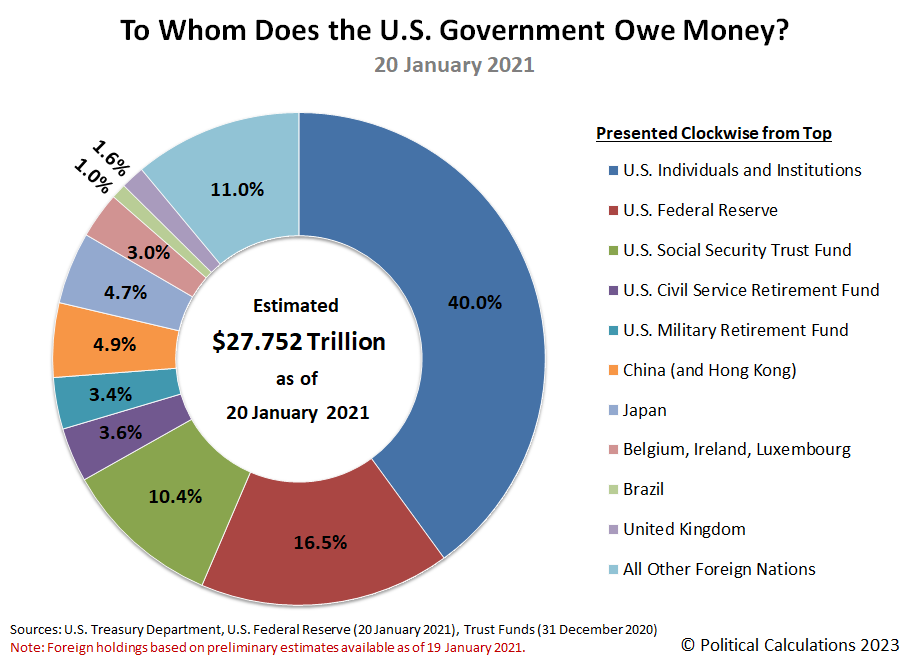
As Joe Biden was sworn in as President of the United States on 20 January 2021, the U.S. national debt reached $27.76 trillion. To whom did the U.S. government owe all that money on that date?
The following chart reveals the major lenders who have fed the U.S. government's spending appetites up through President Biden's inauguration day and shows the estimated share of the U.S. government's total public debt outstanding owed to each.
Update 9 March 2023: This chart has been corrected! We had erroneously copied the total public debt outstanding from 22 January 2021 instead of from 20 January 2021. The original version of the chart is available here.]
The U.S. Federal Reserve is Uncle Sam's largest single entity creditor, having overtaken the Social Security Old Age and Survivors Insurance Trust Fund operated by the U.S. government by a wide margin. The U.S. government owes one out of every six dollars of the U.S. national debt to the U.S.' central bank, which is overseen by an agency of the federal government.
Two other trust funds operated by the U.S. government account loaned a combined 7% of the U.S. national debt. The U.S. Civil Service Retirement Fund and the U.S. Military Retirement Fund have respectively lent 3.6% and 3.4% of the U.S. national debt to the federal government.
A diverse range of U.S. institutions, such as banks, insurance companies, independent corporations, investment firms and individuals combine to hold the largest share of money owed by the U.S. government, accounting for 40% of the total.
Foreign entities hold 25.4% of the total debt liabilities issued by the U.S. government. Of the portion of the national debt owed to foreign-based institutions, China (with Hong Kong) holds the greatest share at 4.9% of the U.S. national debt. Japan comes in second with 4.7%, followed by the international banking centers of Belgium, Ireland, and Luxembourg with a combined 3.0%. The United Kingdom holds 1.6%, while Brazil is owed 1.0% of the U.S. national debt. All the remaining nations of the world combine to hold 11.0%.
About the Data
These figures represent the most current information available as of 20 January 2021, which for the total public debt outstanding and the Federal Reserve's holdings is fully current through 20 January 2021, data on U.S. government entity holdings is current through December 2020, and data for foreign holdings is based on estimates through November 2020 that were published on 19 January 2021.
Labels: data visualization, national debt
Welcome to the blogosphere's toolchest! Here, unlike other blogs dedicated to analyzing current events, we create easy-to-use, simple tools to do the math related to them so you can get in on the action too! If you would like to learn more about these tools, or if you would like to contribute ideas to develop for this blog, please e-mail us at:
ironman at politicalcalculations
Thanks in advance!
Closing values for previous trading day.
This site is primarily powered by:
CSS Validation
RSS Site Feed
JavaScript
The tools on this site are built using JavaScript. If you would like to learn more, one of the best free resources on the web is available at W3Schools.com.
