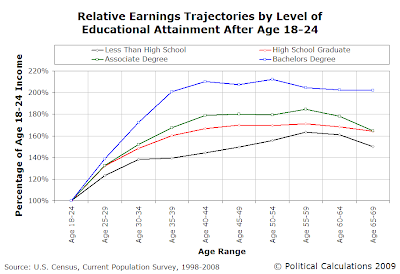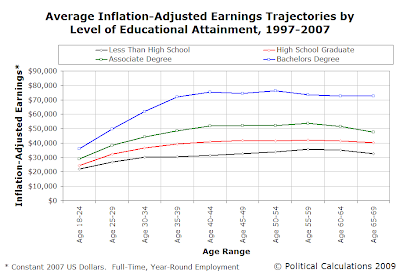
We previously explored the relationship between age, education and inflation-adjusted earnings for another project, but we limited that study to just the first 25 years of a typical bachelor degree holder's life after they graduated from college. Today, we're widening our net to examine how the average individual's income changes over time, depending upon whether they have less than a high school education, have graduated from high school, have earned an Associates degree or have earned a Bachelor's degree as they progress in life from Age 18-24 through Age 65-69.
Building on what we did previously, our first step was to calculate the percentage of Age 18-24 earnings to determine the basic trajectory that each educational peer group took from 1997 through 2007 with respect to this "starting" income using data from the U.S. Census' Current Population Survey covering each of those years, for those working full-time year-round. After calculating the earnings trajectory for each of these years, we averaged the basic trajectories to produce our first chart.
Next, we converted the mean earnings of the Age 18-24 educational peer group for each year to be in constant 2007 U.S. dollars, then found the average and standard deviation, which we've presented in our second chart in this post.

If we omit the annual earnings reported for 2002 for those with less than a high school education and bachelor degree holders, we find the the standard deviation declines from $1,977 to $1,293 for those without high school diplomas or GEDs and from $3,091 to $1,417 for the college graduates. The mean incomes for each group declines from $21,834 to $21,366 for those with less than a high school education and from $35,902 to $35,063 for those holding bachelor degrees. We opted to retain the data for 2002 in producing the charts in this post.

One pattern we note is that income generally rises up through Age 50-54 for each of the educational peer groups. However, we see a significant drop-off in income earned after this age band. This outcome is most likely the result of more successful, higher income-earning individuals opting to retire earlier than their lower income earning peers.
That likelihood is also suggested by the steeper drop-off in annual earnings that we see for the higher income earning educational peer groups after Age 50-54, especially the highest earning bachelor degree holders and associate degree holders as compared to the lower earning high school graduates and those with less than a high school education. In the case of the highest earning bachelor degree holders, we see the maximum earning point reached roughly five years before the same peak earnings point for the other educational peer groups.
Update 12 March 2010: We've developed a tool you can use to project an individual's income at different ages (assuming their income trajectory parallels the average level for an individuals with a similar level of education.) And if you're someone who is conducting demographic research for the Boston Beer Company, or others, we're available for consulting. Just see the "About Political Calculations" in the right hand sidebar at the top for our contact information!...
Labels: data visualization, economics, education, income, income distribution
Welcome to the blogosphere's toolchest! Here, unlike other blogs dedicated to analyzing current events, we create easy-to-use, simple tools to do the math related to them so you can get in on the action too! If you would like to learn more about these tools, or if you would like to contribute ideas to develop for this blog, please e-mail us at:
ironman at politicalcalculations
Thanks in advance!
Closing values for previous trading day.
This site is primarily powered by:
CSS Validation
RSS Site Feed
JavaScript
The tools on this site are built using JavaScript. If you would like to learn more, one of the best free resources on the web is available at W3Schools.com.