Should we rebuild the tool we might very well have lost forever from scratch or should we wait five to seven business days to see if the code can be recovered?
It's almost a classic economics question. We've already sunk time and effort into creating the tool we had planned to post yesterday, so that argues in favor of waiting until the code is recovered from our no-longer functioning USB flash drive. But, that doesn't take into account the risk involved in just letting things ride. We don't know for a certainty if the data on our flash drive can ever be recovered. If it can't, that argues in favor of rebuilding the tool, taking advantage of what we learned in the process of doing it the first time to make the process go quickly.
As you're about to find out, our answer to that question is that we should do both.
One of the things that we've learned over time is that when it comes to coding a major project, it really helps to use a modular approach. That way, we can redeploy code as needed to save time and effort in future projects. For this situation, it occurred to us that we could rebuild a portion of the code, in this case, the portion that mathematically models the distribution of household taxpayer Adjusted Gross Income (AGI) in the United States, and use it in a different application that we would very likely have developed anyway.
More than that, it allowed us to revisit the household income distribution model that we had previously created, exploring an option that we hadn't previously considered: Could we make a model that more accurately reflects reality if we broke the overall distribution into segments?
The answer, luckily, was yes. Better still, should our potentially lost forever code be recovered, we can simply replace the code for our previous income distribution model with the new one. That way, we won't have to rebuild the entire code for that tool from scratch, unless and until we find out for sure that we might have to rebuild the rest of it. Even better, that tool will be better since we've made the model behind it much better!
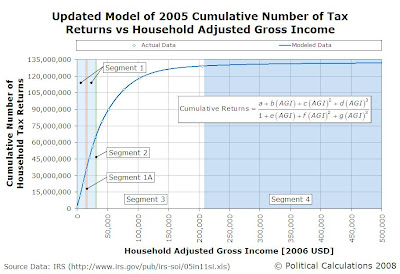
Speaking of which, here's that new distribution, for which we used ZunZun's invaluable 2D Function Finder to identify the NIST Hahn distribution as being particularly good. We've split the distribution into four main segments, based upon AGIs of $0-$28,038, $28,038-$31,630, $31,630-$206,409, and $206,409 on up:

In modeling the cumulative number of tax returns against household adjusted gross income this way, we reduced the error between our model and actual data points to be within plus or minus 0.004% for values from $0 through $206,398. We did find a division by zero anomaly centered on an AGI of $15,600 that affected the calculated results from $14,100 through $17,400, which we corrected with a simple data patch using a NIST Hahn distribution with different coefficients over this range.
Above $206,409, our greatest error is an overcount of 722 at $1,547,988 and the magnitude of the error is within 0.0006% of the actual cumulative number of returns filed in 2005 at this point. Otherwise, the model either slightly overcounts or undercounts the cumulative number of personal income tax returns by magnitudes of plus or minus 0.0003%.
Here's the corresponding chart we have for the number of personal income tax returns filed in 2005 by household Adjusted Gross Income, or in other words, the number of income tax filing households within each $100 interval of Adjusted Gross Income from $0 through $500,000:

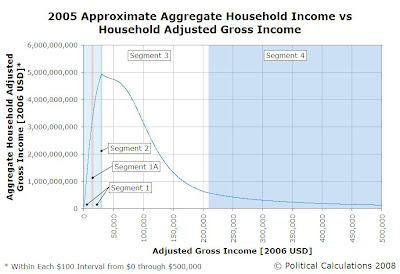
In this chart, you begin to see the effects of a minor blending error between our mathematical models for Segments #1, #2 and #3, which occurs approximately at a household AGI of $31,000. In the next chart, the effect of this blending error will appear to be amplified, as it occurs near the effective peak of where the maximum aggregate amount of household income is to be found in the United States, at the transition between our modeled segments:

We should note that the median household income for our model would be at roughly $31,880, which just above the top income threshold for our Segment #2. Our next chart shows a close-up view of this region of the chart, which confirms that the "peak" is largely a visual artifact given the scale of the chart:

Now we get to the point of this whole exercise! We've rebuilt the portion of our potentially lost code with our mathematical model of the distribution of household income in the United States for 2005, and we've built a tool around it so that anyone can now "read" the values off of each of the charts that we've incorporated into this post!
Our household income distribution model effectively tops out at an AGI of $142,000,000. We've arbitrarily capped the tool's results at this level, as the number of individuals earning this kind of money in a year is awfully sparse. If you enter a larger figure, you'll only get results for this maximum value.
What can we say? Without having access to all the data we typically have on hand to keep working on all our various projects that we have going at any one time, we get bored pretty easily....
Labels: income distribution, taxes, tool
Welcome to the blogosphere's toolchest! Here, unlike other blogs dedicated to analyzing current events, we create easy-to-use, simple tools to do the math related to them so you can get in on the action too! If you would like to learn more about these tools, or if you would like to contribute ideas to develop for this blog, please e-mail us at:
ironman at politicalcalculations
Thanks in advance!
Closing values for previous trading day.
This site is primarily powered by:
CSS Validation
RSS Site Feed
JavaScript
The tools on this site are built using JavaScript. If you would like to learn more, one of the best free resources on the web is available at W3Schools.com.