Pretty darn much, as it turns out! Here's a snapshot chart for 2006, the last full year for which complete data is available (remember, people were still paying their taxes for 2007 as recently as three weeks ago, and that doesn't count all those who filed for extensions on April 15 instead!):

The original source data is here. The chart above shows the amount of collections taken in by the U.S. government from its primary, non-social insurance taxes. Social insurance taxes, like Social Security and Medicare, have their own dedicated taxes, and do not directly feed the U.S. Treasury, as the personal and corporate income taxes, as well as taxes on production, tariffs, etc. listed in the chart do.
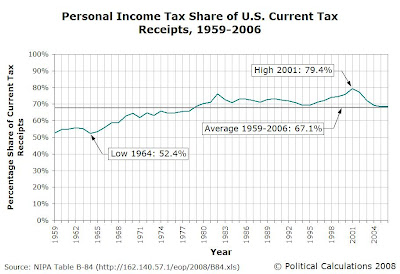
To put 2006's personal income tax share of 68.3% of all the U.S. government's current tax receipts into better context, our next chart shows the percentage share that personal income taxes have represented of all current tax receipts from 1959 through 2006:

We find that 2006's percentage share of 68.5% is slightly above the long term average of 67.1%. In quickly scanning the chart, we see that the peaks of personal income tax collections as a percentage of all current tax receipts often occur in major recession years, with 1982 and 2001 being the standouts. This effect is likely due to the real-time reduction in corporate and other taxes during such times of economic distress, while collections from personal income taxes initially stay high until unemployment rates increase later.
Regardless, at an average of more than two-thirds of all current tax receipts for the period from 1959 through 2006, the U.S. federal government is highly dependent upon collecting personal income taxes.
Labels: taxes
Welcome to the blogosphere's toolchest! Here, unlike other blogs dedicated to analyzing current events, we create easy-to-use, simple tools to do the math related to them so you can get in on the action too! If you would like to learn more about these tools, or if you would like to contribute ideas to develop for this blog, please e-mail us at:
ironman at politicalcalculations
Thanks in advance!
Closing values for previous trading day.
This site is primarily powered by:
CSS Validation
RSS Site Feed
JavaScript
The tools on this site are built using JavaScript. If you would like to learn more, one of the best free resources on the web is available at W3Schools.com.