When we originally developed our two-quarter GDP bullet thermometer chart as a visual tool that we could use to better describe the overall health of the U.S. economy, we did so to address a deficiency that Bill Polley observed in the traditional definition of a recession as being a two-quarter period of negative GDP growth: those times when the GDP number bounces back and forth across the zero line between positive and negative territory.
Since our primary metric for GDP is the economic growth rate annualized over the previous two-quarter period, we automatically account for that situation. Using this two-quarter GDP growth rate, we can much more easily identify recessionary periods using just GDP data.
Then we went a step beyond that. We also incorporated David Tufte's GDP "grading scale" into our bullet chart visualization, which appears as the temperature scale gradients, but we did so in a way that would blend the transitions between otherwise distinct boundaries in that scale.
This blending effect allows us to account for something that's often missed in GDP reporting: the margin of error. We recognize that GDP figures are subject to revision, first in moving from the advance release for a given quarter, through the next preliminary release and then onto a "final" revision. And then, perhaps months or years later, the "final" revision for a quarter is perhaps revised again, as more economic data about the time becomes known. This blending allows for us to anticipate any potential downward revisions.
Today's advance release of GDP for the first quarter of 2008 (available in this PDF document) indicates that the U.S. economy is essentially on the edge of being in recession. With the two-quarter annualized GDP growth rate at 0.6%, it falls directly in the transition range between the "cold" purple zone indicating recession and the "cool" blue zone indicating slow growth:

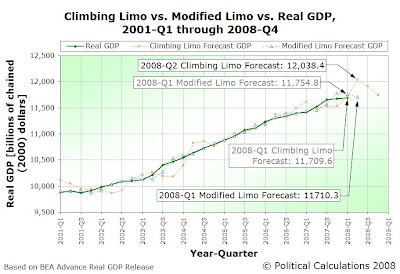
Eerily, at 0.6%, the GDP growth rate for 2008Q1 comes in right where both the Climbing Limo GDP forecasting method and our Modified Limo forecasting method would have placed it. The following chart shows where the advance release figure for 2008Q1 would be along with where both the Climbing and Modified Limo projection techniques anticipated it, along with the latest forecasts for each:

We would anticipate that the GDP figure for the second quarter of 2008 will come in between the forecast values for each of our Limo methods, however given the sharp rise and decline of the Climbing Limo forecast (which indicates changes in economic momentum), we would expect it to much more closely track the value for the Modified Limo forecast. At best, that would indicate that the U.S. economy is moving through a very slow growth period, edging the boundary of recession.
Bear in mind however that we will be revising this forecast twice more, as the 2008Q1 GDP data goes through it's preliminary and final revisions.
The 2008Q1 GDP Data Commented Upon Elsewhere
Greg Mankiw sees the glass half full and notes that Intrade's odds of recession in 2008 have dropped to 25% (although to be fair, the Intrade bet is whether there will be two consecutive quarters of negative growth!)
Barry Ritholtz is out of pocket at this writing, but will have comment soon, with a special focus upon corporate profits, the PCE inflation measure and seasonal adjustments.
Mark Perry makes the no recession call (yes, we hope he's ultimately right!)
Tom Blumer notes that the Democrats will have to put off their glee at being able to blame Bush for negative economic growth for at least another quarter.
Jim Hamilton has updated his Recession Indicator Index, which ticked up to 26.9% with the latest data. A reading of 65% is needed to anticipate the NBER's decision to declare 2008Q1 to have been in recession.
Bill Polley touches on the GDP report in providing an essential review of the Fed's action today, and also can claim bragging rights since his class correctly anticipated the Fed's action!
Finally, the WSJ surveys a number of institutional economists on their views of whether the economy is indeed in recession.
Labels: gdp, gdp forecast
Welcome to the blogosphere's toolchest! Here, unlike other blogs dedicated to analyzing current events, we create easy-to-use, simple tools to do the math related to them so you can get in on the action too! If you would like to learn more about these tools, or if you would like to contribute ideas to develop for this blog, please e-mail us at:
ironman at politicalcalculations
Thanks in advance!
Closing values for previous trading day.
This site is primarily powered by:
CSS Validation
RSS Site Feed
JavaScript
The tools on this site are built using JavaScript. If you would like to learn more, one of the best free resources on the web is available at W3Schools.com.