Every now and then, I find it useful to create a post just for the purpose of being able to reference basic data without having to point at the original source ad nauseum, especially when the original source is a table full of data where I'm simply interested in one particular data point or a trend. With that in mind, here is a brief summary of the history of the taxes that support Social Security's retirement benefit program, that provides the information in a graphical format for easier consumption. Larger versions of the images may be seen by clicking on the smaller ones.
Where Your Social Security Taxes Go Now
Currently, your employer and/or you pay an amount into Social Security equal to 12.4% of your annual earned income, up until your income reaches the maximum taxable amount of $90,000. The taxes that are paid into Social Security are divided into two major programs. Approximately 1.8% of an individual's income is set aside to provide Disability Insurance (DI) benefits, while a amount roughly equal to 10.6% of their income is dedicated toward providing Old Age and Survivor's Insurance (OASI) benefits, from which all Social Security retirement benefits are paid. The percentages provided toward each program listed above are approximate since a fractional amount of your total taxes paid in cover Social Security's administrative costs. The following chart illustrates the overall distribution of your Social Security taxes:

The History of OASI Taxes
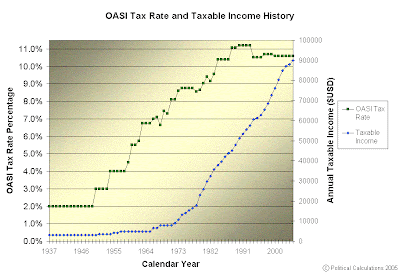
Since the ability of the OASI program to provide future retirement benefits is the focus of the present debate on reforming the program, we'll take a closer look at the history its funding. The following chart illustrates the changes in Social Security's OASI combined employer/individual tax rate and the corresponding level of taxable income over the life of the Social Security program:

Source: Tax Rates and Maximum Taxable Income for Social Security, Railroad Retirement and Railroad Unemployment Insurance Programs (available as a 226KB PDF document from the U.S. Government's Railroad Retirement Board)
In the chart above, the upper set of points correlates with the axis on the left, which shows the history of the OASI Tax Rate as a percentage of annual income, while the lower set of points correlates with the axis on the right, which depicts the history of the OASI Taxable Income cap.
The following charts show the percentage increase or decrease in the levels of both the OASI Tax Rate and the OASI Taxable Income cap over the life of the Social Security program. The first chart shows the magnitude of OASI Tax Rate changes expressed as a percentage of the previous tax rate level:

As you can see from this chart, the magnitude of changes in the OASI Tax Rate has tended to decrease over time, and has only stabilized around the 10.6% level in recent years. However, that doesn't mean that OASI taxes haven't continued increasing. Instead, the government has preferred to indirectly increase taxes by steadily increasing the amount of income that may be taxed. The chart below presents this data as a percentage increase or decrease in the previous level of the amount of taxable income:

The Supplemental Security Income Program
One of the more common misconceptions related to the distribution of Social Security taxes is related to the Supplemental Security Income (SSI) Program, which provides monthly benefits to people who are age 65 or older, or are blind or disabled, and have limited income and financial resources. Although the SSI program is managed by the Social Security Administration, no Social Security taxes go toward paying these benefits. Instead, the funds for SSI benefits are drawn directly from the U.S. Treasury's general fund, which is where all other tax revenue collected by the federal government is pooled. For more information about the SSI program, see the Social Security Administration's booklet Understanding SSI.
Labels: social security
Welcome to the blogosphere's toolchest! Here, unlike other blogs dedicated to analyzing current events, we create easy-to-use, simple tools to do the math related to them so you can get in on the action too! If you would like to learn more about these tools, or if you would like to contribute ideas to develop for this blog, please e-mail us at:
ironman at politicalcalculations
Thanks in advance!
Closing values for previous trading day.
This site is primarily powered by:
CSS Validation
RSS Site Feed
JavaScript
The tools on this site are built using JavaScript. If you would like to learn more, one of the best free resources on the web is available at W3Schools.com.