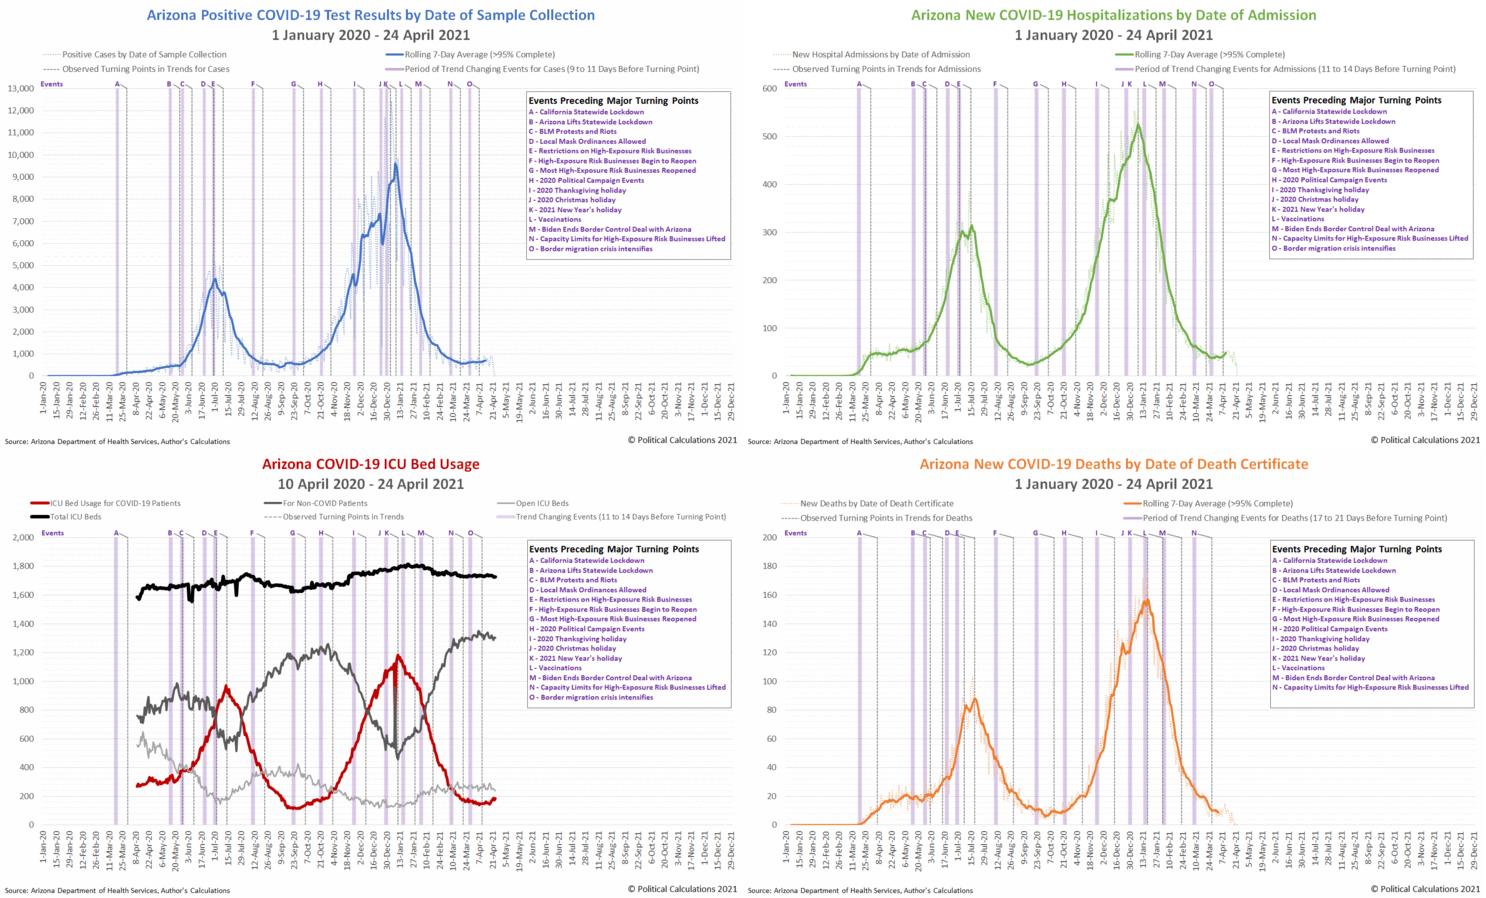
Three of the four high quality COVID-19 datasets we track for Arizona indicate a new adverse change in trends for the coronavirus pandemic in the state. Arizona's data for positive test results by date of sample collection, new hospital admissions, and ICU bed usage are confirming an increase in the incidence of COVID in the state. The fourth dataset for COVID-19 deaths by recorded date of death certificate does not as yet, but would not be expected to as yet because this data has the greatest lag from a change in the rate of incidence to the confirmation of a change in trend.
We've generated the following animated chart to cycle through each of the charts for these four datasets.
Considering the respective lags that apply for each dataset, the likely timing of a significant change in the rate of incidence for SARS-CoV-2 coronavirus infections in the state between 26 March 2021 and 30 March 2021. This period coincides with contemporary news accounts of the Biden administration moving migrants from overloaded Border Patrol migrant facilities in Arizona counties bordering Mexico to facilities and small towns in Maricopa and Pinal Counties.
We think this activity is showing up in Arizona's COVID-19 statistics because these migrants have been exposed to Mexico's higher incidence of COVID-19 infections. While those cases peaked in late January 2021, several weeks after they peaked and began falling in Arizona, the relative difference in infection rates between Arizona's population and the entering migrants is enough to affect the trends for Arizona's COVID-19 data.
On 26 March 2021, Senator Mark Kelly (D-AZ) stated the Biden administration did not have an effective plan for the border. It took another month for President Biden to acknowledge the migration crisis at the U.S. border with Mexico as a crisis.
President Biden, talking to reporters after finishing golf today, concedes border issues are a “crisis,” saying refugee cap was linked to the “crisis that ended up on the border with young people.”
“We couldn’t do two things at once. And now we are going to increase the number.” pic.twitter.com/dwvrRM792k— TV News HQ (@TVNewsHQ) April 18, 2021
On 21 April 2021, Arizona Governor Doug Ducey declared a state of emergency and sent Arizona National Guard troops to Arizona's border counties.
Coincidentally, that was the last date we updated our series on the COVID-19 pandemic in Arizona, where our analysis of the trends just before that point of time appeared very early in the morning....
Previously on Political Calculations
Here is our previous coverage of Arizona's experience with the coronavirus pandemic, presented in reverse chronological order.
- Improving COVID Trends Bottom and Flatline in Arizona
- Surge of Migrants, Lifting of Business Capacity Limits Change Arizona COVID Trends
- COVID-19 in Retreat in Arizona With Vaccines Gaining Traction
- The Ebb and Flow of COVID-19 in Arizona's ICUs
- Arizona's Plunging COVID-19 Caseloads and the Vaccines
- Arizona Enters Downward Trend for COVID-19 After Second Peak
- Arizona Passes Second COVID-19 Peak
- A Tale of Two States and the Coronavirus
- COVID-19 Questions, Answers, and Lessons Learned from Arizona
- The Deadly Intersection of Anti-Police Protests and COVID-19
- 2020 Campaign Events Drive Surge in Arizona COVID Cases
- Arizona Arrives at Critical Junction for Coronavirus Cases
- Arizona To Soon Reach A Critical Junction For COVID-19
- Getting More Than Care from Arizona's COVID ICU Beds
- Arizona's Decentralized Approach to Beating COVID
- Going Back to School with COVID-19
- Arizona Turns Second Corner Toward Crushing Coronavirus
- Arizona's Coronavirus Crest in Rear View Mirror
- The Coronavirus Turns a Corner in Arizona
- A Delayed First Wave Crests in the U.S. and a Second COVID-19 Wave Arrives
- The Coronavirus in Arizona
- A Closer Look at COVID-19 Deaths in Arizona
- The New Epicenter of COVID-19 in the U.S.
- How Long Does a Serious COVID Infection Typically Last?
- How Deadly is the COVID-19 Coronavirus?
- Governor Cuomo and the Coronavirus Models
- How Do False Test Outcomes Affect Estimates of the True Incidence of Coronavirus Infections?
- How Fast Could China's Coronavirus Spread?
References
We've continued following Arizona's experience during the coronavirus pandemic because the state's Department of Health Services makes detailed, high quality time series data available, which makes it easy to apply the back calculation method to identify the timing and events that caused changes in the state's COVID-19 trends. This section links that that resource and many of the others we've found useful throughout the coronavirus pandemic.
Arizona Department of Health Services. COVID-19 Data Dashboard: Vaccine Administration. [Online Database]. Accessed 25 April 2021.
Stephen A. Lauer, Kyra H. Grantz, Qifang Bi, Forrest K. Jones, Qulu Zheng, Hannah R. Meredith, Andrew S. Azman, Nicholas G. Reich, Justin Lessler. The Incubation Period of Coronavirus Disease 2019 (COVID-19) From Publicly Reported Confirmed Cases: Estimation and Application. Annals of Internal Medicine, 5 May 2020. https://doi.org/10.7326/M20-0504.
U.S. Centers for Disease Control and Prevention. COVID-19 Pandemic Planning Scenarios. [PDF Document]. Updated 10 September 2020.
More or Less: Behind the Stats. Ethnic minority deaths, climate change and lockdown. Interview with Kit Yates discussing back calculation. BBC Radio 4. [Podcast: 8:18 to 14:07]. 29 April 2020.
