Arizona's COVID-19 statistics are continuing to trend in the right direction.
That's remarkable because of the decentralized approach the state's leaders have taken to address the coronavirus pandemic since the state became an epicenter for infections in June 2020. Unlike places like New York, whose governor has imposed one-size-fits-all mandates on residents and businesses within the state, Arizona Governor Doug Ducey enabled county and city officials to adopt their own coronavirus mitigation strategies, tailored for their communities. The approach has generally allowed many businesses to remain open and for residents to go about their lives with considerably fewer restrictions placed upon them than what people in New York are having to endure.
And yet, despite having experienced a similar rate of spread of SARS-CoV-2 coronavirus infections as New York did in early 2020, while allowing more economic and social activities than New York has, Arizona's coronavirus numbers indicate the state's decentralized approach to dealing with the coronavirus since it lifted its statewide lockdown orders on 15 May 2020 has been effective.
In the following sections, we'll look at the historical and latest trends for the number of cases, deaths, and hospitalizations in Arizona.
Cases
The following chart tracks the daily number of confirmed COVID-19 cases that have been reported in Arizona according to their sample collection date during the past seven months. Please click here to access a larger version of the chart.
Since we've previously discussed the historic data through August 2020, we'll pick up our analysis with September 2020, which has seen a small uptick in the number of positive COVID-19 test results.
That uptick corresponds to the start of Fall sessions at the state's public universities, where most of these new cases are concentrated among the student populations. In our next chart, we break down the state's daily reporting of new cases according to age demographic, over the period from 14 June 2020 through 5 October 2020, which encompases both the peak of the coronavirus pandemic in Arizona and the state's back-to-school season. Please click here to access a larger version of the chart.
The chart confirms that the trend for new coronavirus cases in Arizona among its Age 0-19 and Age 20-44 demographic groups, which includes the state's school and college-age population, began deviating from the trends for older Arizonans in late August. After a period of increase, particularly at the University of Arizona, actions taken by that university's administrators appear to have reduced the incidence of new infections in the Age 0-19 portion of the state's population. A similar trend has also occurred for the Age 20-44 group, although it is now seeing a slow upward trend, which is still below the level of the mid-September bump.
The overall trends for older Arizonans has remained essentially flat since late August 2020, which points to the back-to-school season and its associated social interactions among students as the main source of increased infections in the state.
Regardless, the state's overall level of infections falls well within a range that would be easily manageable for public health officials.
Deaths
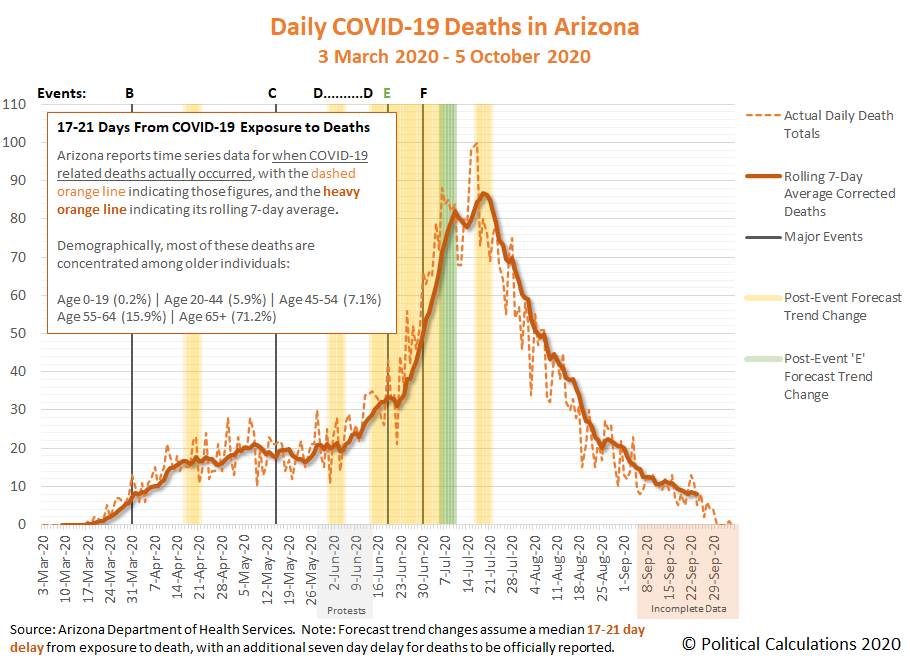
Arizona's data for COVID-19 deaths reveals the benefit of the state's decentralized approach to protecting older residents. The state's rolling 7-day average of deaths has fallen below the levels that were recorded during its statewide lockdown, which ran from 31 March 2020 through 15 May 2020, which can be seen in the next chart. Please click here to access a larger version of the chart.
Arizona's statewide lockdown, which resembled the policies implemented in New York, proved to be ineffective in avoiding coronavirus deaths, which took off shortly after it was lifted on 15 May 2020. The actions that did make a difference can be traced to Events "E" and "F" indicated on the chart, which correspond with Governor Ducey's actions to authorize local actions (these are described in the table below).
Hospitalizations
The data trends for hospitalizations is very similar to that for deaths. The following chart shows the current level of hospitalizations falling well below Arizona's statewide lockdown period. Please click here to access a larger version of the chart.
Arizona's COVID-19 hospitalization data was recently corrected to address a data reporting error, in which Arizonans who went to an urgent care facility to have a coronavirus test that came back with a positive result were erroneously counted as having been admitted to a hospital for treatment, even though most of these individuals simply went home with minor health issues to quarantine and recuperate. The error appears to have affected the counts of newly admitted hospital patients going back to 1 July 2020.
Significant Events
The following table summarizes the major events indicated in these charts.
| Timeline of Events Affecting Rate of Spread of COVID-19 Coronavirus in Arizona | |||
|---|---|---|---|
| Event/Date | Description | Observed Change in Trends for Hospitalizations 11-13 Days Later | |
| A 19 Mar 2020 | California imposes statewide lockdown order | Significant change from rising to steady (bounded range) rate of hospitalizations. We think Arizonans effectively implemented practices to minimize their exposure risk to potential coronavirus infections, which then happened to show up as a change in trend immediately after Arizona implemented its own statewide lockdown order. | |
| B 31 Mar 2020 | Arizona imposes statewide lockdown order through April 2020 | Minimal change, new COVID-19 hospitalizations continue within bounded range. We think the main effect of the lockdown order was to standardize how Arizonans minimized their coronavirus exposure risks, which allowed the benefits to extend until the order was lifted, although that came at great economic cost. The lockdown would later be extended to 15 May 2020. | |
| C 15 May 2020 | Arizona lifts statewide lockdown order | Significant change from steady to rising rate of new cases, hospitalizations, and deaths. | |
| D 28 May 2020 to 15 Jun 2020 | Large scale political protests (Black Lives Matter/George Floyd/Anti-Police) | Change in rate of growth in rate of new hospital admissions as the protests greatly increased the risk and rate of exposure to the coronavirus for younger Arizonans, who are less likely to require hospitalization. Sharp increase in number of cases not requiring hospital admission. | |
| E 19 Jun 2020 | Governor Ducey's executive order allowing counties to require wearing masks in public venues begins to be implemented. | Significant change as new COVID-19 hospital admissions peak and begin to decline. Upward trend in deaths stop as state turns first corner toward improvement. | |
| F 30 Jun 2020 | Arizona imposes 'mini-lockdown' order | Significant change, with acceleration in decline of number of cases. Deaths peak before turning a corner and beginning a rapid decline. | |
| G 1 Aug 2020 | Expanded testing capacity comes online | Significant reduction in number of reported confirmed cases, as test labs speed processing and eliminate backlog. Continued downward trend. | |
Arizona vs New York
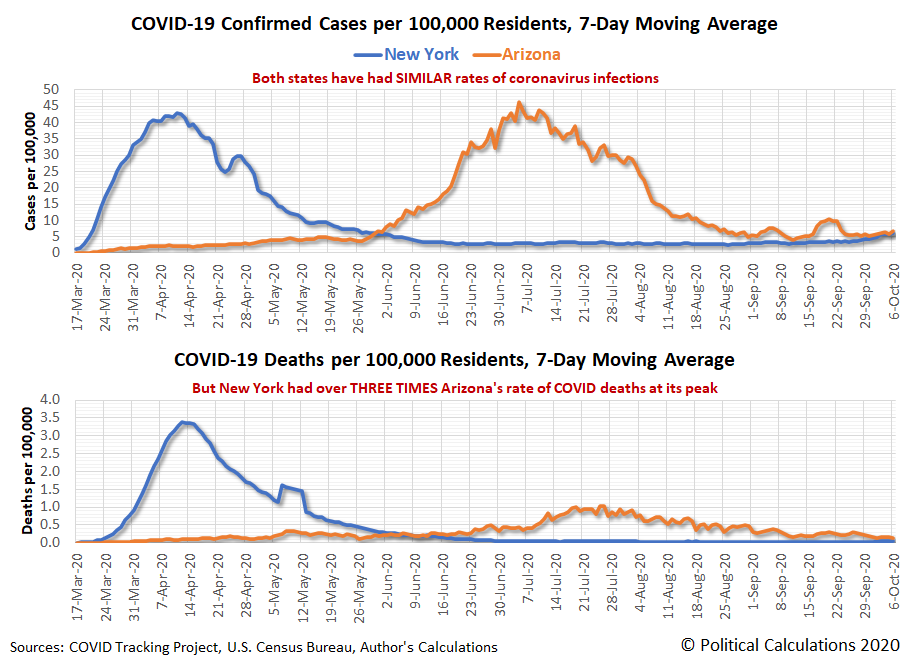
We'll conclude by updating our chart using data from the COVID Tracking Project to compare the daily reported number of confirmed COVID-19 cases and deaths per 100,000 residents in both Arizona and New York from 17 March 2020 through 6 October 2020. Please click here to access a larger version of the chart.
New York's governor has engaged in one of the most centralized and repressive lockdown regimes in the United States. Arizona's governor has adopted a far more decentralized approach that has enabled more economic and social activities. Though Arizona has seen a similar rate of incidence of coronavirus cases among its population, it has seen significantly fewer deaths per 100,000 residents, even at its peak.
Today, both states are seeing similar rates of new COVID-19 cases among their residents. In which of these two states would you rather live?
Epilogue
Update 8 October 2020: If it helps to answer that final question, the Wall Street Journal published a map showing the change in payroll employment across the U.S. from February 2020 through August 2020 (via Barry Ritholtz):
Bonus question: Can you tell from the map which states have had the most repressive, top-down responses to the spread of COVID-19?
Previously on Political Calculations
- Going Back to School with COVID-19
- Arizona Turns Second Corner Toward Crushing Coronavirus
- Arizona's Coronavirus Crest in Rear View Mirror
- The Coronavirus Turns a Corner in Arizona
- A Delayed First Wave Crests in the U.S. and a Second COVID-19 Wave Arrives
- The Coronavirus in Arizona
- A Closer Look at COVID-19 Deaths in Arizona
- The New Epicenter of COVID-19 in the U.S.
- How Long Does a Serious COVID Infection Typically Last?
- How Deadly is the COVID-19 Coronavirus?
- Governor Cuomo and the Coronavirus Models
- How Do False Test Outcomes Affect Estimates of the True Incidence of Coronavirus Infections?
- How Fast Could China's Coronavirus Spread?
References
Arizona Department of Health Services. COVID-19 Data Dashboard. [Online Application/Database].
Maricopa County Coronavirus Disease (COVID-19). COVID-19 Data Archive. Maricopa County Daily Data Reports. [PDF Document Directory, Daily Dashboard].
Stephen A. Lauer, Kyra H. Grantz, Qifang Bi, Forrest K. Jones, Qulu Zheng, Hannah R. Meredith, Andrew S. Azman, Nicholas G. Reich, Justin Lessler. The Incubation Period of Coronavirus Disease 2019 (COVID-19) From Publicly Reported Confirmed Cases: Estimation and Application. Annals of Internal Medicine, 5 May 2020. https://doi.org/10.7326/M20-0504.
U.S. Centers for Disease Control and Prevention. COVID-19 Pandemic Planning Scenarios. [PDF Document]. Updated 10 September 2020.
COVID Tracking Project. Most Recent Data. [Online Database]. Accessed 6 October 2020.
Labels: coronavirus, data visualization, health
Welcome to the blogosphere's toolchest! Here, unlike other blogs dedicated to analyzing current events, we create easy-to-use, simple tools to do the math related to them so you can get in on the action too! If you would like to learn more about these tools, or if you would like to contribute ideas to develop for this blog, please e-mail us at:
ironman at politicalcalculations
Thanks in advance!
Closing values for previous trading day.
This site is primarily powered by:
CSS Validation
RSS Site Feed
JavaScript
The tools on this site are built using JavaScript. If you would like to learn more, one of the best free resources on the web is available at W3Schools.com.


