In just a month, the global economy has gone from showing signs of stalling growth to providing strong evidence the Earth's economy has resumed shrinking.
That's evident from the sharp drop in the pace at which carbon dioxide is increasing in the Earth's atmosphere recorded at the remote Mauna Loa observatory during the last month. The following chart confirms that outcome as measured by the trailing twelve month average of year-over-year change in the atmospheric concentration of carbon dioxide:
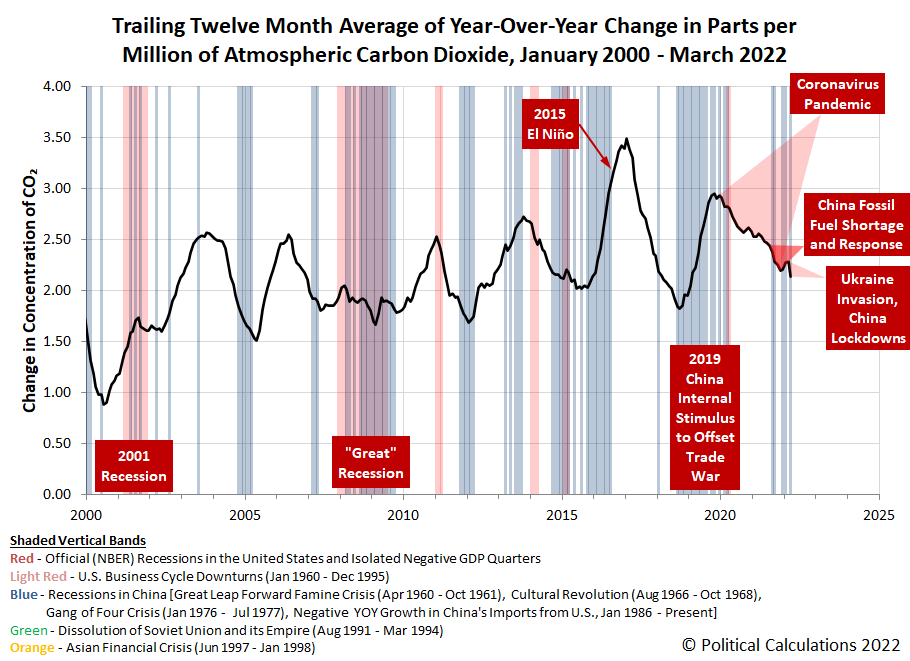
There are two driving factors behind this development. First, Russia's 24 February 2022 invasion of Ukraine has disrupted coal, oil and especially natural gas flows from Russia to the European Union, as many EU nations are boycotting or have implemented economic sanctions against Russian firms.
The second major factor is China's increasing use of lockdowns as the government struggles to prevent the spread of COVID-19 within the country, which is also the world's largest emitter of carbon dioxide. The lockdowns have shut down the country's largest economic center and are now spreading to more regions along with coronavirus infections.
In terms of overall impact for the global economy, we view Russia's invasion of Ukraine as a secondary event, while China's ongoing use of lockdowns clearly represents a continuation of the global coronavirus pandemic recession that originated within the country in 2019.
Update 20 April 2022
Welcome MarketWatch readers! For those interested, we have created a tool to estimate how the change in atmospheric carbon dioxide translates into lost GDP for the planet. Here are the earliest and most recent posts from that series where we've put a number on that impact:
A quick back of the envelope calculation with a net reduction of -0.80 parts per million in the rate at which carbon dioxide is being added to the Earth's atmosphere from December 2019 through March 2022 puts the estimated net global GDP loss at $26.6 trillion. This estimate is likely on the high side of what the IMF and World Bank would estimate.
Reference
National Oceanographic and Atmospheric Administration. Earth System Research Laboratory. Mauna Loa Observatory CO2 Data. [Text File]. Updated 8 April 2022. Accessed 8 April 2022.
Labels: coronavirus, environment, recession


Arizona's coronavirus pandemic experience is nearing its end has come to an end.
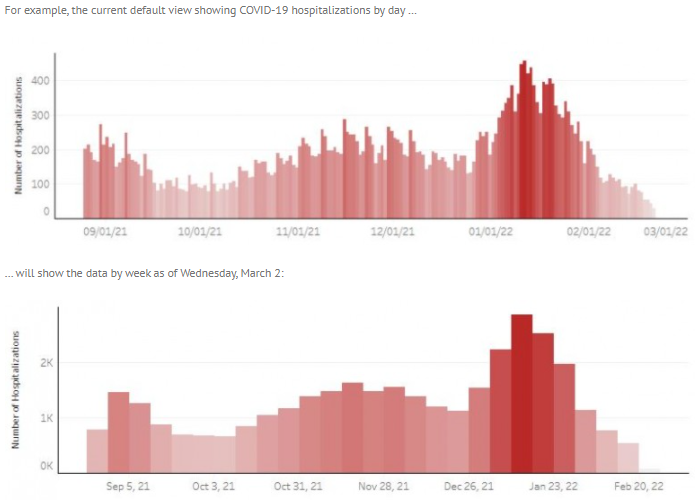
The first sign that was the case came just a few days after the penultimate update to our long-running series. Arizona's Department of Health Services announced it would suspend daily reporting of the state's data on cases, hospitalizations, deaths, and numerous other related metrics on 26 February 2022 in a transition to weekly reporting that would begin on 2 March 2022. Here's an example of how the state's presentation of its data for new COVID-related hospital admissions presentation changed:
We've followed Arizona's experience with the coronavirus pandemic for two reasons. First, we were among the first analysts to confirm the state had become an epicenter for COVID-19 infections within the U.S. in June 2020. Second, Arizona is one of 26 states that presented its high quality COVID-19 data on a daily basis, which made it possible to use back calculation techniques to identify both the timing and causes of major turning points in the state's pandemic experience, which we've featured throughout the series.
The change to weekly reporting however closes off our ability to continue our analysis, because the weekly data isn't granular enough to zero in on events contributing to changes in the state's COVID trends. That change however is something that only makes sense for public health officials if they no longer anticipate a need to continue that kind of tracking. It's good news.
Flashing forward one month later, Arizona remained one of 21 states with active COVID-19 emergency orders in effect. Arizona's public officials began signaling they would soon end the state of emergency for the coronavirus pandemic. Here's a Q&A with Arizona's Governor Doug Ducey from 23 March 2022:
Q: Any plans to end the state of emergency?
Ducey: Yes. The emergency is over, look around. The state is wide open. I think we had record number of people out for the Waste Management Phoenix Open. Spring training in full bloom and people are coming here from around the country and around the world to watch the games, so we’re excited about it. We’re winding down a number of things that are purely administrative. We’re working with the legislature, the general fund and federal authorities to bring an end to all of that.
So are we a couple of weeks away from that ending? Months? Days? "It's coming," Ducey remarked.
On 25 March 2022, Arizona's state government took a major step that will allow it to lift its two-year-old state of emergency for the pandemic.
Arizona Gov. Doug Ducey has signed legislation that will prevent temporary medical licenses issued under his coronavirus executive orders from immediately becoming invalid if he ends the state of emergency he issued two years ago.
Friday’s action extends temporary licenses issued since the Republican governor first declared a state of emergency on March 11, 2020. They will be valid until the end of the year if they were active at the start of this month.
Rep. Joanne Osborne of Goodyear told fellow Republicans in a caucus meeting last week that more than 2,200 licenses remain active, including about 1,200 issued to nurses. A waiver issued by the Department of Health Services under Ducey’s emergency order allowed doctors, nurses and other qualified health professionals to be licensed even if they lack current training or other requirements for an Arizona license.
The extension of the temporary licenses will allow boards that issue them time to process permanent license applications. The bill passed the Senate and House with only one no vote.
“If we want the emergency orders to end, this has to be taken care of first,” Republican Rep. Regina Cobb said at the same meeting of GOP House members. “And then once this is taken care of, then the governor can do what he needs to do as far as ending any emergency orders.”
At this writing, though it hasn't officially happened yet, the proverbial writing is on the wall. We've reached the end of our series on Arizona's experience with the coronavirus pandemic!
Previously on Political Calculations
Here is our previous coverage of Arizona's experience with the coronavirus pandemic, presented in reverse chronological order.
- The End of Arizona's Coronavirus Pandemic Experience
- Omicron Rapidly Fades in Arizona
- Omicron Arrives in Arizona
- Upswing in Arizona COVID Cases Shows Signs of Peaking, Crowded ICUs
- COVID-19 Cases on Upswing in Arizona
- Arizona's COVID Hospital Admissions Unexpectedly Plunge
- All Indicators Confirm COVID Third Wave Receding in Arizona
- Arizona's Third COVID Wave Peaks and Begins to Recede
- Arizona COVID Cases Rising in Third Wave
- Arizona COVID Cases on Slow Uptrend in Summer 2021
- Increase in Arizona COVID Cases from Border Migration Crisis Stabilizing
- COVID-19 and the 2021 Border Migration Crisis in Arizona
- Improving COVID Trends Bottom and Flatline in Arizona
- Surge of Migrants, Lifting of Business Capacity Limits Change Arizona COVID Trends
- COVID-19 in Retreat in Arizona With Vaccines Gaining Traction
- The Ebb and Flow of COVID-19 in Arizona's ICUs
- Arizona's Plunging COVID-19 Caseloads and the Vaccines
- Arizona Enters Downward Trend for COVID-19 After Second Peak
- Arizona Passes Second COVID-19 Peak
- A Tale of Two States and the Coronavirus
- COVID-19 Questions, Answers, and Lessons Learned from Arizona
- The Deadly Intersection of Anti-Police Protests and COVID-19
- 2020 Campaign Events Drive Surge in Arizona COVID Cases
- Arizona Arrives at Critical Junction for Coronavirus Cases
- Arizona To Soon Reach A Critical Junction For COVID-19
- Getting More Than Care from Arizona's COVID ICU Beds
- Arizona's Decentralized Approach to Beating COVID
- Going Back to School with COVID-19
- Arizona Turns Second Corner Toward Crushing Coronavirus
- Arizona's Coronavirus Crest in Rear View Mirror
- The Coronavirus Turns a Corner in Arizona
- A Delayed First Wave Crests in the U.S. and a Second COVID-19 Wave Arrives
- The Coronavirus in Arizona
- A Closer Look at COVID-19 Deaths in Arizona
- The New Epicenter of COVID-19 in the U.S.
- How Long Does a Serious COVID Infection Typically Last?
- How Deadly is the COVID-19 Coronavirus?
- Governor Cuomo and the Coronavirus Models
- How Do False Test Outcomes Affect Estimates of the True Incidence of Coronavirus Infections?
- How Fast Could China's Coronavirus Spread?
References
Political Calculations has been following Arizona's experience with the coronavirus experience from almost the beginning, because the state makes its high quality data publicly available. Specifically, the state's Departent of Health Services reports the number of cases by date of test sample collection, the number of hospitalizations by date of hospital admission, and the number of deaths by date recorded on death certificates.
This data, combined with what we know of the typical time it takes to progress to each of these milestones, makes it possible to track the state's daily rate of incidence of initial exposure to the variants of the SARS-CoV-2 coronavirus using back calculation methods. Links to that data and information about how the back calculation method works are presented below:
Arizona Department of Health Services. COVID-19 Data Dashboard: Vaccine Administration. [Online Database]. Accessed 17 February 2022.
Stephen A. Lauer, Kyra H. Grantz, Qifang Bi, Forrest K. Jones, Qulu Zheng, Hannah R. Meredith, Andrew S. Azman, Nicholas G. Reich, Justin Lessler. The Incubation Period of Coronavirus Disease 2019 (COVID-19) From Publicly Reported Confirmed Cases: Estimation and Application. Annals of Internal Medicine, 5 May 2020. https://doi.org/10.7326/M20-0504.
U.S. Centers for Disease Control and Prevention. COVID-19 Pandemic Planning Scenarios. [PDF Document]. 10 September 2020.
More or Less: Behind the Stats. Ethnic minority deaths, climate change and lockdown. Interview with Kit Yates discussing back calculation. BBC Radio 4. [Podcast: 8:18 to 14:07]. 29 April 2020.
Labels: coronavirus
The pace at which carbon dioxide is increasing in the Earth's atmosphere slowed significantly according to data recorded at the remote Mauna Loa observatory for March 2022. The following chart shows the latest development for the trailing twelve month average of year-over-year change in the atmospheric concentration of carbon dioxide:
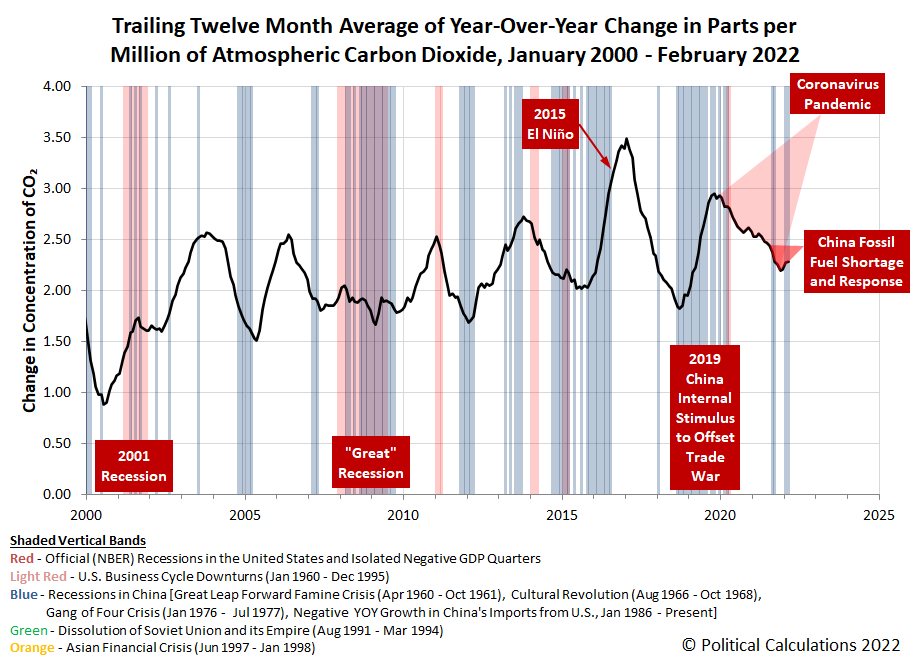
That change interrupts what had been a robust upturn in CO₂ emissions, driven primarily by China's record coal spree in recent months. The new change however coincides with indications that China's economic growth has sharply slowed in 2022, as indicated by its negative year-over-year growth rate for imports from the United States for December 2021 and January 2022.
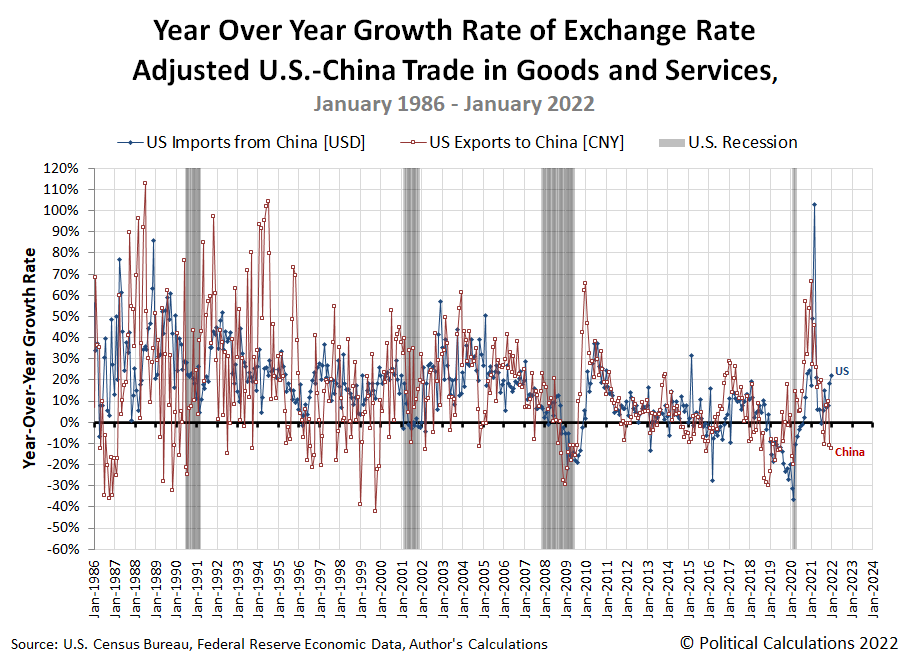
That reduction is attributable to China's ongoing struggle with COVID-19, which disrupted economic activity in the Earth's biggest emitter of carbon dioxide in both December 2021 and January 2021. Allowing for the lag in China's carbon dioxide emissions to diffuse into the Earth's air, we think that economic slowdown is now showing up in March 2022's atmospheric CO₂ measurements. With China's government still committed to its COVID-zero policies and still locking down millions of China's productive population for weeks at a time as coronavirus infections continue to spread in the country despite its measures, we anticipate reduced carbon dioxide emissions will show up in the Earth's air from the world's biggest carbon emitter over the next several months.
National Oceanographic and Atmospheric Administration. Earth System Research Laboratory. Mauna Loa Observatory CO2 Data. [Text File]. Updated 7 March 2022. Accessed 9 March 2022.
Labels: coronavirus, economics, environment, recession, trade
Having closed the door for assessing the performance of the January 2020 'Phase 1' trade deal between the U.S. and China, we've refocused our ongoing trade analysis to focus on the trade recovery from 2020's coronavirus pandemic.
To do that, we need to compare the actual trajectory of the trade between the U.S. and China with a counterfactual - a projection of what the future for trade could reasonably look like following a recession. For our purposes, we opted to model a counterfactual after the recovery in trade between the U.S. and China that followed the so-called "Great Recession". The following chart shows the trailing twelve month average of the combined value of that trade as the heavy black line, where the counterfactual is shown by the dashed red line. We're using the trailing twelve month average to account, in part, for the seasonality in the actual monthly data, which we've shown as the thinner purple line.
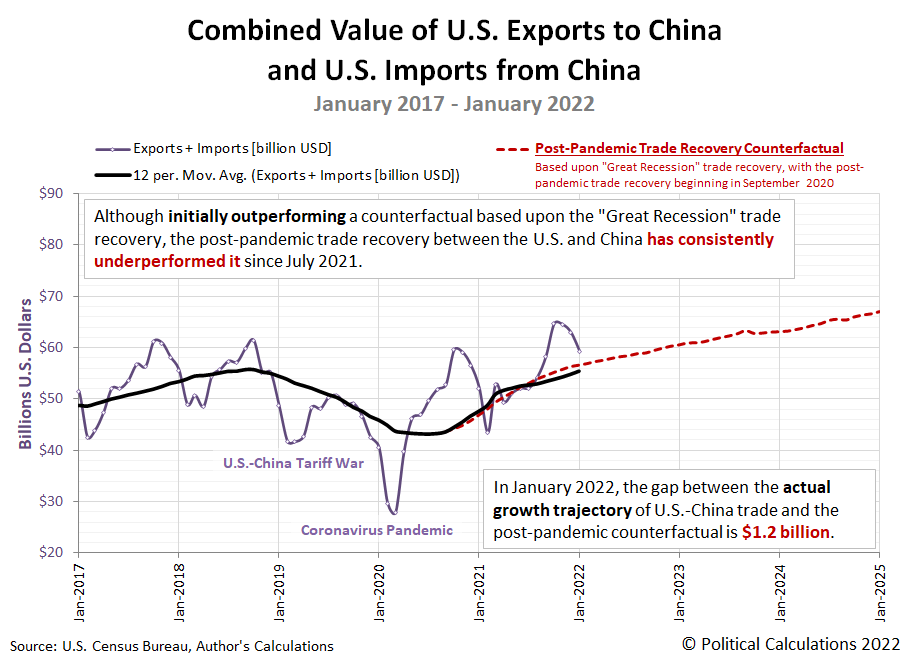
Going by the trailing twelve month average of the combined value of goods exchanged between the U.S. and China, the recovery in trade between the two countries began after this measure bottomed in September 2020. In the first ten months since, up to July 2021, the rate of growth of trade outperformed what was observed in the recovery following the "Great Recession". But since July 2021, the level of trade has consistently underperformed the Great Recession trade recovery. In January 2022, it would take an additional $1.2 billion of goods traded between the two countries to match that earlier recovery.
In truth, that underperformance took hold several months earlier, following March 2021, after a spike in the value of goods traded between the two countries was recorded. This period roughly coincides with a growing backlog of container ships at the U.S.' west coast ports, and specifically at the ports of Los Angeles and Long Beach in southern California. These two ports typically account for 40% of all imported goods processed into the U.S. economy, where congestion at these two ports built up and was allowed to fester for months without any action to correct the worsening situation by the Biden administration.
The good news is that after months of neglect, the Biden administration was finally forced to take steps to address the problem. There are indications the worst of the trade congestion at these two ports is in the rear view mirror.
That's a positive development, which we see in the small narrowing of the gap between the counterfactual and the actual trajectory of the U.S.-China trade level in January 2022. We'll see how well that progress might continue in the months ahead.
Labels: coronavirus, recession, trade
Four weeks ago, we covered the arrival of the Omicron-wave of the coronavirus pandemic in Arizona. Four weeks later, the weak variant is well on its way to fading into the obsurity of history.
Despite being impressively contagious and easy to spread, the Omicron variant of the SARS-CoV-2 coronavirus lacked the severity that characterized previous waves of coronavirus infections in Arizona. We confirm that's the case with the state's high quality data on COVID-related hospitalization and deaths, where we find neither have trended in the state in th elevated way that cases have. We've visualized these data series, where we've aligned the data for each according to when Arizonans who became infected with COVID-19 were most likely first exposed to the viral infection.
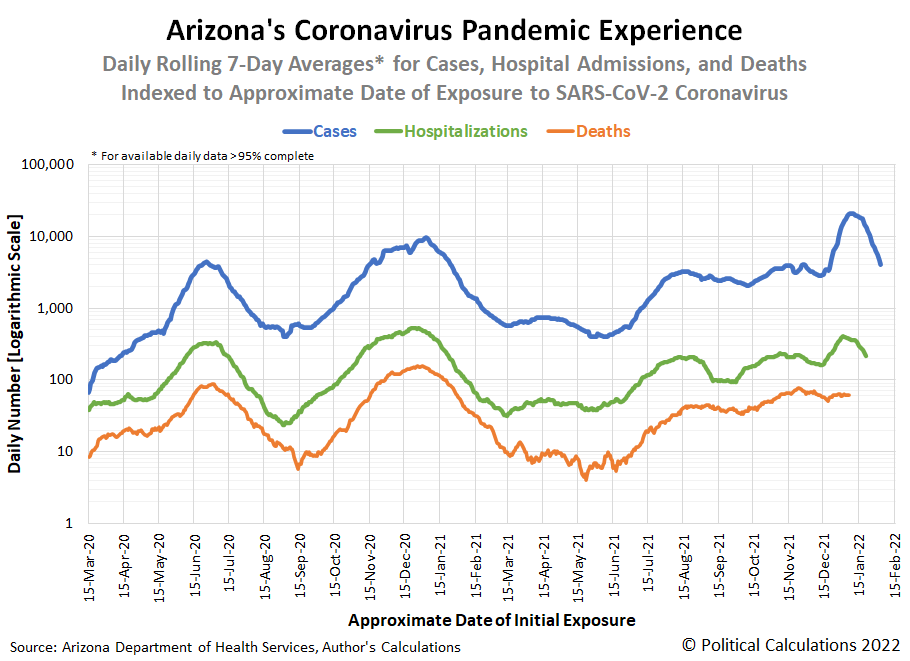
Based on Arizona's data for cases, new hospital admissions, and deaths, the Omicron variant of the coronavirus began noticeably spreading approximately in the period from 15 through 19 December 2021. That covers the weekend before the Christmas holiday, which points to public events like shopping, Phoenix' Fiesta Bowl Parade, and pre-holiday social events as the likely venues in which infections of the Omicron coronavirus variant took hold in the state.
After lifting off, the surge in COVID infections went on to peak in the period from 31 December 2021 through 7 January 2022, pointing to the end of the holiday season and its related social gatherings as a leading contributor to what is developing into a rapid decline in the incidence of new infections.
The data for deaths is remarkable because Arizona's wave of delta-variant coronavirus infections has largely blended with the omicron-variant in such a way that the overall trend in deaths has fallen within a relatively narrow range since early November 2021. Or rather, as deaths attributed to the more deadly delta-variant waned, they were replaced almost one-for-one by the much less deadly omicron-variant, where infections were occurring in much higher numbers. We anticipate that pattern will hold until the lagging data for deaths catches up to the rapidly declining trends for both cases and hospitalizations in the state.
Arizona's data for ICU bed usage confirms the rapid decline in omicron-related COVID-19 cases in recent weeks.

While rising in response to Omicron-variant cases, ICU bed usage data points to a lower growth rate for serious cases requiring ICU facilities at this time. The data confirms Arizona's hospitals have maintained high rates of ICU bed utilization, with hospital operators working to keep as many beds occupied with both COVID and non-COVID patients as they could. We have not yet however found any explanation for the reduction in ICU beds in Arizona in mid-December 2021.
We're coming up on the two year anniversary of the coronavirus pandemic in Arizona, which if the positive trends now developing continue to hold, will mark our last regular entry for this series as the pandemic appears to be approaching its end.
Previously on Political Calculations
Here is our previous coverage of Arizona's experience with the coronavirus pandemic, presented in reverse chronological order.
- Omicron Rapidly Fades in Arizona
- Omicron Arrives in Arizona
- Upswing in Arizona COVID Cases Shows Signs of Peaking, Crowded ICUs
- COVID-19 Cases on Upswing in Arizona
- Arizona's COVID Hospital Admissions Unexpectedly Plunge
- All Indicators Confirm COVID Third Wave Receding in Arizona
- Arizona's Third COVID Wave Peaks and Begins to Recede
- Arizona COVID Cases Rising in Third Wave
- Arizona COVID Cases on Slow Uptrend in Summer 2021
- Increase in Arizona COVID Cases from Border Migration Crisis Stabilizing
- COVID-19 and the 2021 Border Migration Crisis in Arizona
- Improving COVID Trends Bottom and Flatline in Arizona
- Surge of Migrants, Lifting of Business Capacity Limits Change Arizona COVID Trends
- COVID-19 in Retreat in Arizona With Vaccines Gaining Traction
- The Ebb and Flow of COVID-19 in Arizona's ICUs
- Arizona's Plunging COVID-19 Caseloads and the Vaccines
- Arizona Enters Downward Trend for COVID-19 After Second Peak
- Arizona Passes Second COVID-19 Peak
- A Tale of Two States and the Coronavirus
- COVID-19 Questions, Answers, and Lessons Learned from Arizona
- The Deadly Intersection of Anti-Police Protests and COVID-19
- 2020 Campaign Events Drive Surge in Arizona COVID Cases
- Arizona Arrives at Critical Junction for Coronavirus Cases
- Arizona To Soon Reach A Critical Junction For COVID-19
- Getting More Than Care from Arizona's COVID ICU Beds
- Arizona's Decentralized Approach to Beating COVID
- Going Back to School with COVID-19
- Arizona Turns Second Corner Toward Crushing Coronavirus
- Arizona's Coronavirus Crest in Rear View Mirror
- The Coronavirus Turns a Corner in Arizona
- A Delayed First Wave Crests in the U.S. and a Second COVID-19 Wave Arrives
- The Coronavirus in Arizona
- A Closer Look at COVID-19 Deaths in Arizona
- The New Epicenter of COVID-19 in the U.S.
- How Long Does a Serious COVID Infection Typically Last?
- How Deadly is the COVID-19 Coronavirus?
- Governor Cuomo and the Coronavirus Models
- How Do False Test Outcomes Affect Estimates of the True Incidence of Coronavirus Infections?
- How Fast Could China's Coronavirus Spread?
References
Political Calculations has been following Arizona's experience with the coronavirus experience from almost the beginning, because the state makes its high quality data publicly available. Specifically, the state's Departent of Health Services reports the number of cases by date of test sample collection, the number of hospitalizations by date of hospital admission, and the number of deaths by date recorded on death certificates.
This data, combined with what we know of the typical time it takes to progress to each of these milestones, makes it possible to track the state's daily rate of incidence of initial exposure to the variants of the SARS-CoV-2 coronavirus using back calculation methods. Links to that data and information about how the back calculation method works are presented below:
Arizona Department of Health Services. COVID-19 Data Dashboard: Vaccine Administration. [Online Database]. Accessed 17 February 2022.
Stephen A. Lauer, Kyra H. Grantz, Qifang Bi, Forrest K. Jones, Qulu Zheng, Hannah R. Meredith, Andrew S. Azman, Nicholas G. Reich, Justin Lessler. The Incubation Period of Coronavirus Disease 2019 (COVID-19) From Publicly Reported Confirmed Cases: Estimation and Application. Annals of Internal Medicine, 5 May 2020. https://doi.org/10.7326/M20-0504.
U.S. Centers for Disease Control and Prevention. COVID-19 Pandemic Planning Scenarios. [PDF Document]. 10 September 2020.
More or Less: Behind the Stats. Ethnic minority deaths, climate change and lockdown. Interview with Kit Yates discussing back calculation. BBC Radio 4. [Podcast: 8:18 to 14:07]. 29 April 2020.
Labels: coronavirus, data visualization
China's fossil fuel shortage has fully reversed. Thanks largely to what is now being described in the media as a "record coal spree", the country is described as now having adequate supplies to get through the winter.
The Chinese government's "coal spree" has produced some stunning numbers for coal imports and domestic production. China's imports of coal sharply increased in 2021, as its imports dipped in December 2021 after peaking in November 2021 as China's domestic coal production soared.
China's fossil fuel shortage prompted officials to crank up domestic coal mining, resulting in record output from coal mines in both December 2021 and for the entire calendar year.
China’s coal output hit record highs in December and in the full year of 2021, as the government continued to encourage miners to ramp up production to ensure sufficient energy supplies in the winter heating season.
China, the world’s biggest coal miner and consumer, produced 384.67 million tonnes of the fossil fuel last month, up 7.2% year-on-year, data from the National Bureau of Statistics showed on Monday. This compared with a previous record of 370.84 million tonnes set in November.
For the full year of 2021, output touched a record 4.07 billion tonnes, up 4.7% on the previous year.
Since October, authorities have ordered coal miners to run at maximum capacity to tame red-hot coal prices and prevent a recurrence of September’s nationwide power crunch that disrupted industrial operations and added to factory gate inflation.
China hasn't let the additional coal it has bought and mined in panic sit around. Chinese power plants have been burning it in great quantities, which has resulted in a very noticable increase in the rate at which carbon dioxide is accumulating in the Earth's atmosphere.
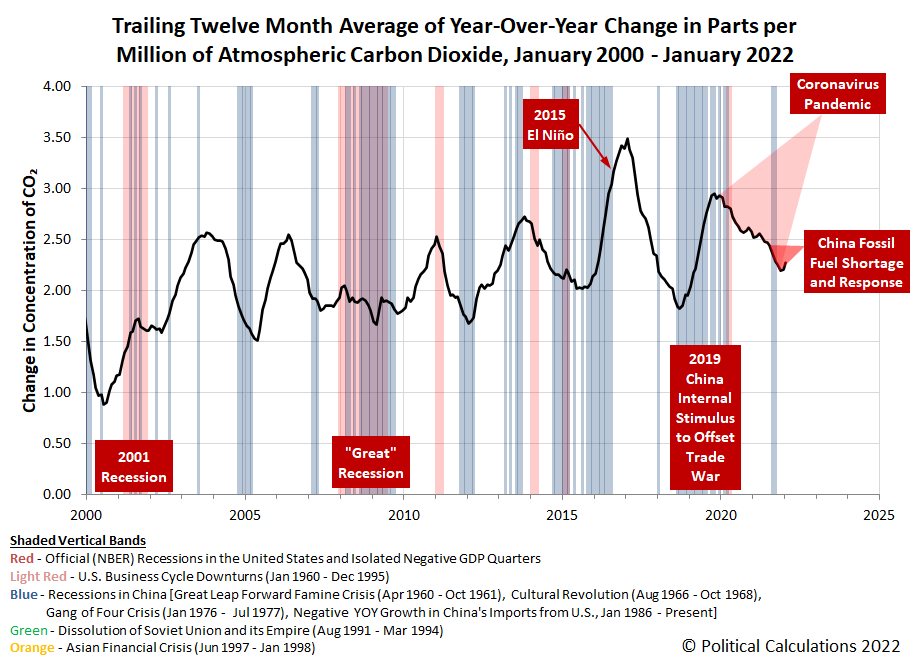
Given its coincidental timing with the waning of the global coronavirus pandemic, the environmental impact of China burning the coal it acquired through it's coal spree may also finally mark the bottom of the coronavirus pandemic itself.
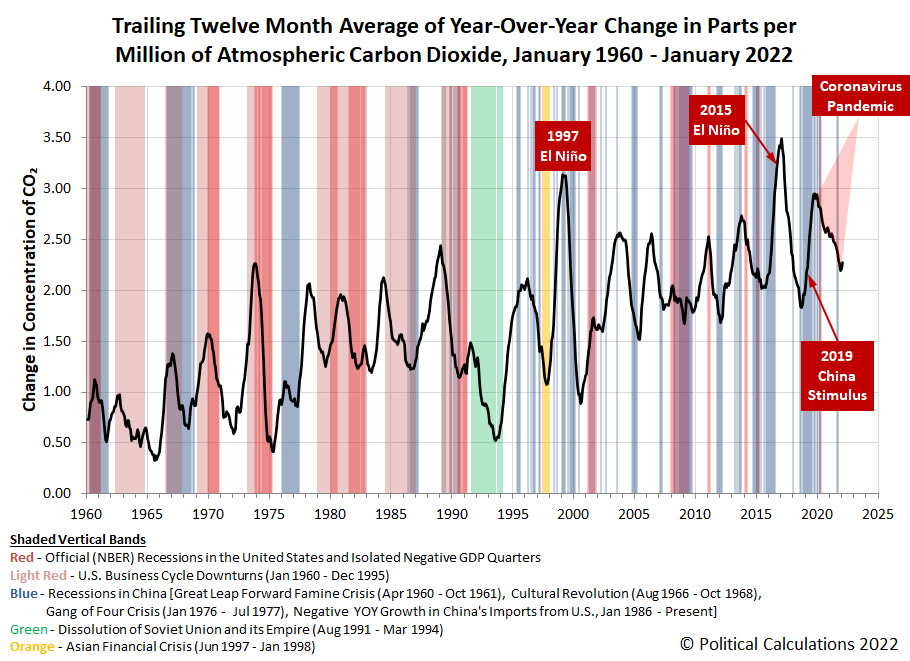
Since we happen to be at an anniversary date for the data, we'll close by presented an updated version of this chart, which spans back to January 1960 to provide additional historic context.
References
National Oceanographic and Atmospheric Administration. Earth System Research Laboratory. Mauna Loa Observatory CO2 Data. [Text File]. Updated 8 February 2022. Accessed 8 February 2022.
Labels: coronavirus, economics, environment
When we last reviewed Arizona's coronavirus pandemic experience in mid-December 2021, we reported the Delta-variant wave looked to be peaking. In fact, we followed up with an update to that article on 21 December 2021 to confirm it.
Since we reported that data, the Omicron-variant of the SARS-CoV-2 coronavirus arrived, with a rate of spread that exceeds each of the previous waves Arizona has experienced. At least, that's what immediately leaps out in the newest update to our chart tracking Arizona's Coronavirus Pandemic Experience, so let's go straight to it.

The data for cases, hospitalizations, and deaths presented in this chart has been aligned with respect to the approximate date for when those who tested positive, were admitted to hospital, or died would have first been exposed to SARS-CoV-2 coronavirus variants. Presenting the data this way makes it possible to visually identify when the incidence of infection changes. Having that information often makes it possible to identify significant events that affected the trends for COVID infections.
Based on Arizona's data for cases and for new hospital admissions, the Omicron variant of the coronavirus began noticeably spreading approximately on or around 19 December 2021. That's the weekend before the Christmas holiday, which points to public events like shopping, Phoenix' Fiesta Bowl Parade, and pre-holiday social events as the likely venues in which infections of the Omicron coronavirus variant took hold in the state. Unlike the most recent uptrend, few high-attendance sporting events took place Arizona during that period. We likewise expect to see similar liftoff in the data for COVID deaths as that much longer lagging data becomes available.
Behind the scenes, we've looked at new hospital admission data that has not yet been added to this chart because it is less than 95% of the value where it will stabilize for the indicated dates. Based on that partially complete information, we anticipate the data for COVID hospitalizations will parallel the rapid increase already evident for cases confirmed by testing.
Meanwhile, the data for COVID deaths in Arizona during this period is far too incomplete as yet to add an additional confirmation of the 19 December 2021 date marking the arrival of widespread Omicron-variant coronavirus infection in Arizona. The state's data for ICU admissions however points to 19 December 2021 as the kickoff date for the spread of Omicron-variant COVID cases, assuming a 13-day lag from initial exposure, which we see with COVID-infected ICU patients beginning to increase after 1 January 2022. That change in trend may be seen in Arizona's ICU bed usage chart.
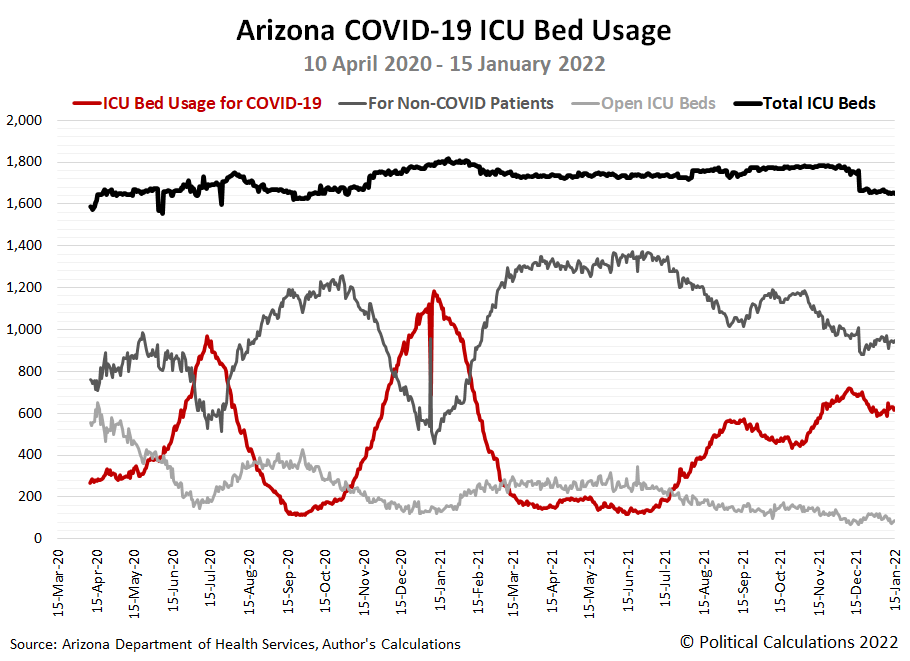
While rising in response to Omicron-variant cases, ICU bed usage data points to a lower growth rate for serious cases requiring ICU facilities at this time.
Arizona's ICU COVID-19 bed usage chart also points to an unusual development, in which the number of Arizona's intensive care units was arbitrarily reduced by about 90 units on 18 December 2021, with the impact concentrated in beds being used by non-COVID ICU patients. We have found no contemporary reporting to explain why that happened. Since we previously reported Arizona's available supply of ICU beds was becoming pinched in early December 2021, we believe that decision should be called into question given the developing situation with the Omicron variant in the state.
We'll close with some better news. Going back to the first chart, we see the rate at which new COVID cases are occurring in Arizona has begun to slow in the period since 1 January 2022. Though it is still rising, which we anticipate will continue for several weeks, each previous wave of COVID infections in Arizona was preceded by a similar deceleration before peaking.
Previously on Political Calculations
Here is our previous coverage of Arizona's experience with the coronavirus pandemic, presented in reverse chronological order.
- Omicron Arrives in Arizona
- Upswing in Arizona COVID Cases Shows Signs of Peaking, Crowded ICUs
- COVID-19 Cases on Upswing in Arizona
- Arizona's COVID Hospital Admissions Unexpectedly Plunge
- All Indicators Confirm COVID Third Wave Receding in Arizona
- Arizona's Third COVID Wave Peaks and Begins to Recede
- Arizona COVID Cases Rising in Third Wave
- Arizona COVID Cases on Slow Uptrend in Summer 2021
- Increase in Arizona COVID Cases from Border Migration Crisis Stabilizing
- COVID-19 and the 2021 Border Migration Crisis in Arizona
- Improving COVID Trends Bottom and Flatline in Arizona
- Surge of Migrants, Lifting of Business Capacity Limits Change Arizona COVID Trends
- COVID-19 in Retreat in Arizona With Vaccines Gaining Traction
- The Ebb and Flow of COVID-19 in Arizona's ICUs
- Arizona's Plunging COVID-19 Caseloads and the Vaccines
- Arizona Enters Downward Trend for COVID-19 After Second Peak
- Arizona Passes Second COVID-19 Peak
- A Tale of Two States and the Coronavirus
- COVID-19 Questions, Answers, and Lessons Learned from Arizona
- The Deadly Intersection of Anti-Police Protests and COVID-19
- 2020 Campaign Events Drive Surge in Arizona COVID Cases
- Arizona Arrives at Critical Junction for Coronavirus Cases
- Arizona To Soon Reach A Critical Junction For COVID-19
- Getting More Than Care from Arizona's COVID ICU Beds
- Arizona's Decentralized Approach to Beating COVID
- Going Back to School with COVID-19
- Arizona Turns Second Corner Toward Crushing Coronavirus
- Arizona's Coronavirus Crest in Rear View Mirror
- The Coronavirus Turns a Corner in Arizona
- A Delayed First Wave Crests in the U.S. and a Second COVID-19 Wave Arrives
- The Coronavirus in Arizona
- A Closer Look at COVID-19 Deaths in Arizona
- The New Epicenter of COVID-19 in the U.S.
- How Long Does a Serious COVID Infection Typically Last?
- How Deadly is the COVID-19 Coronavirus?
- Governor Cuomo and the Coronavirus Models
- How Do False Test Outcomes Affect Estimates of the True Incidence of Coronavirus Infections?
- How Fast Could China's Coronavirus Spread?
References
Political Calculations has been following Arizona's experience with the coronavirus experience from almost the beginning, because the state makes its high quality data publicly available. Specifically, the state's Departent of Health Services reports the number of cases by date of test sample collection, the number of hospitalizations by date of hospital admission, and the number of deaths by date recorded on death certificates.
This data, combined with what we know of the typical time it takes to progress to each of these milestones, makes it possible to track the state's daily rate of incidence of initial exposure to the variants of the SARS-CoV-2 coronavirus using back calculation methods. Links to that data and information about how the back calculation method works are presented below:
Arizona Department of Health Services. COVID-19 Data Dashboard: Vaccine Administration. [Online Database]. Accessed 17 January 2022.
Stephen A. Lauer, Kyra H. Grantz, Qifang Bi, Forrest K. Jones, Qulu Zheng, Hannah R. Meredith, Andrew S. Azman, Nicholas G. Reich, Justin Lessler. The Incubation Period of Coronavirus Disease 2019 (COVID-19) From Publicly Reported Confirmed Cases: Estimation and Application. Annals of Internal Medicine, 5 May 2020. https://doi.org/10.7326/M20-0504.
U.S. Centers for Disease Control and Prevention. COVID-19 Pandemic Planning Scenarios. [PDF Document]. 10 September 2020.
More or Less: Behind the Stats. Ethnic minority deaths, climate change and lockdown. Interview with Kit Yates discussing back calculation. BBC Radio 4. [Podcast: 8:18 to 14:07]. 29 April 2020.
Labels: coronavirus, data visualization
When we last checked up on Arizona's experience with the coronavirus pandemic a month ago, we confirmed a new uptrend in cases had begun. We had tracked the timing of the origins of that new upswing to the weekend of 8 October through 11 October 2021, coinciding with multiple high attendance sporting events in the state.
A month later, that upswing is showing signs of peaking. The following chart shows the latest trends for the number of COVID cases, hospital admissions, and deaths indexed to the approximate date of when those infected were initially exposed to the variants of the SARS-CoV-2 coronavirus being transmitted within the state.
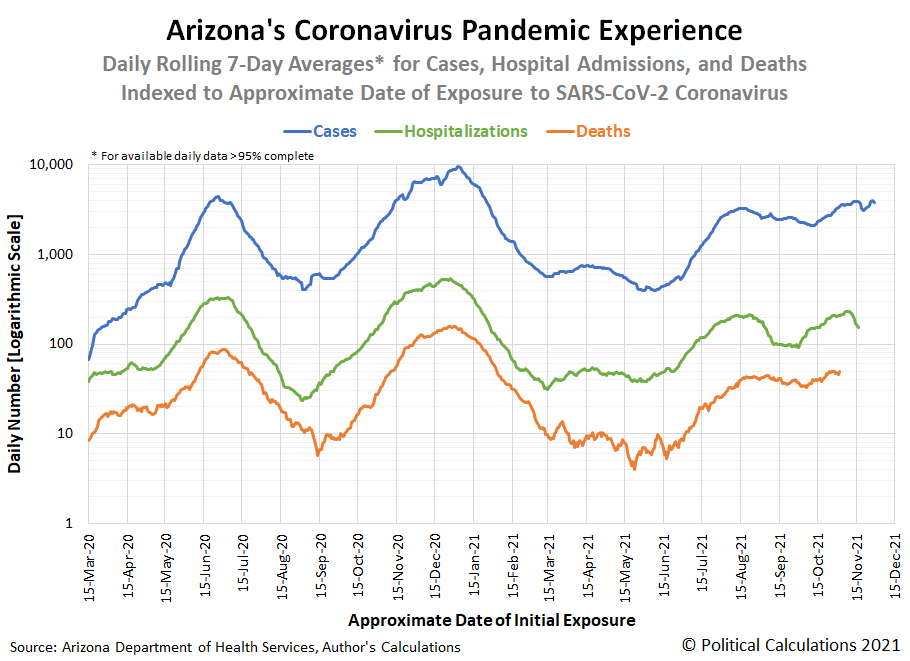
The state's detailed data for both hospital admissions and deaths has followed the pattern for the uptrend in cases. However, with compared with the pre-COVID vaccine era for the pandemic, we confirm lower rates of new hospital admissions and deaths with respect to the number of recorded cases in the period with the vaccines widely available and improved treatments.
Arizona however is facing a new challenge: a dwindling supply of Intensive Care Unit beds. The next chart shows the situation that has developed over the past month:
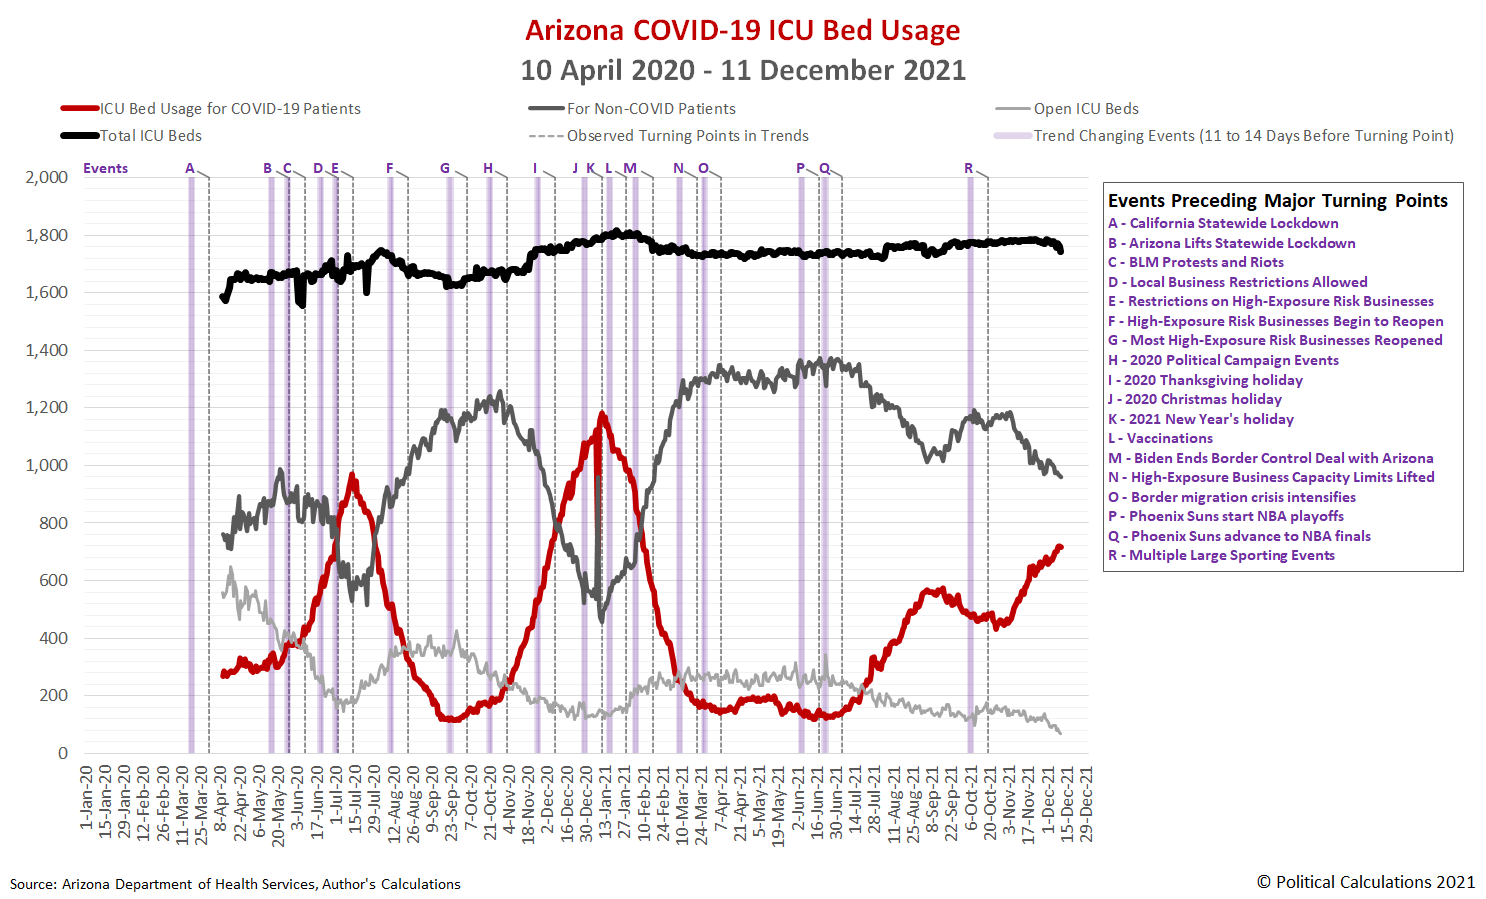
Unlike in 2020, Arizona's hospitals have sought to avoid clearing their ICU units to dedicate space exclusively for COVID patients in 2021. However, the rising number of cases in the latest upswing has led to several ICUs in the state nearing their capacities.
For the first time this entire pandemic, Arizona hospitals have less than 80 total ICU beds available. At Valleywise Health, a spokesperson confirmed there are currently three available. But some medical professionals are worried that things will only get worse the deeper we head into winter. "If we can feel the heat already, then we're already at a level where people should be mindful and doing what they can," Valleywise district medical group vice-chair of surgery Dr. Ross Goldberg said.
With only three ICU beds available, Goldberg and the rest of his staff are preparing for a scenario where that number gets even lower. But he's holding out hope that never happens. "We are constantly watching our situation," Goldberg said. "We are allocating resources as needed to make sure we're getting people taken care of. But again, we don't want to find what those breaking points are. We don't really want to stress the system to that level."
Across Arizona hospitals, ICU bed availability is either at zero or approaching that number. At Flagstaff Medical Center, the only Level I trauma center north of Maricopa County, they are currently at ICU capacity with a waiting list. But if someone shows up needing an ICU bed, a hospital spokesperson confirmed to Arizona's Family that they will be provided with one.
In December 2020, media reports that Arizona's hospital ICU capacity was becoming scarce helped contribute to a positive development in the state's COVID trends. With signs the latest uptrend in cases is already peaking, we may see a similar development in the weeks ahead.
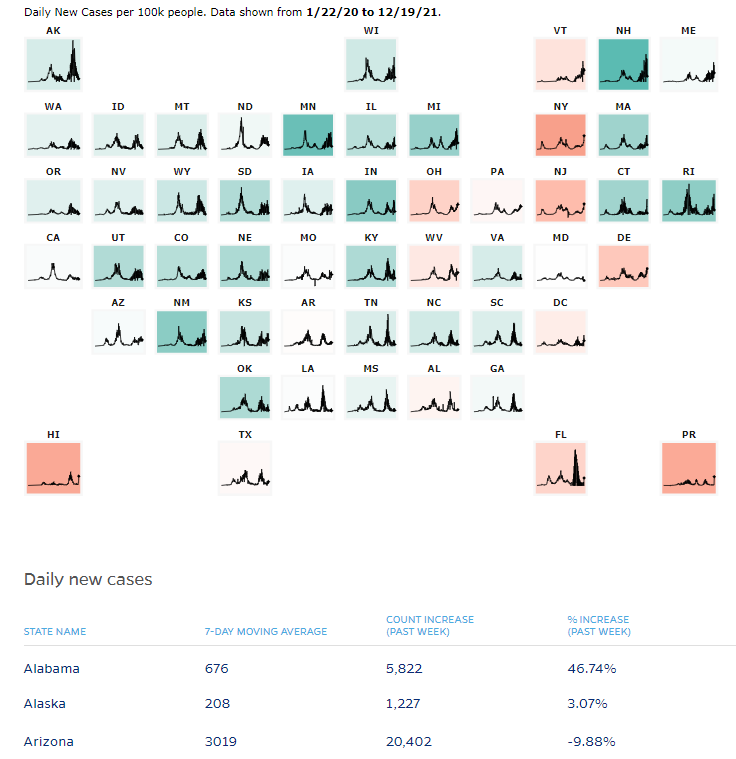
Update 21 December 2021: Data tracking from Johns Hopkins confirms Arizona's new cases have peaked. Here's their chart showing state-by-state trends as of 19 December 2021, where Arizona's new case count has dropped by almost 10% during the previous seven days:
On the plus side, major sport leagues in the U.S. are now postponing games in the recognition their large attendance events are contributing to adverse trends for COVID, as our analysis indicates they did starting from early-October 2021 to cause Arizona's most recent upswing in cases. We may also have been the first analysts to directly make that connection in the new wave of cases in the U.S.
Previously on Political Calculations
Here is our previous coverage of Arizona's experience with the coronavirus pandemic, presented in reverse chronological order.
- Upswing in Arizona COVID Cases Shows Signs of Peaking, Crowded ICUs
- COVID-19 Cases on Upswing in Arizona
- Arizona's COVID Hospital Admissions Unexpectedly Plunge
- All Indicators Confirm COVID Third Wave Receding in Arizona
- Arizona's Third COVID Wave Peaks and Begins to Recede
- Arizona COVID Cases Rising in Third Wave
- Arizona COVID Cases on Slow Uptrend in Summer 2021
- Increase in Arizona COVID Cases from Border Migration Crisis Stabilizing
- COVID-19 and the 2021 Border Migration Crisis in Arizona
- Improving COVID Trends Bottom and Flatline in Arizona
- Surge of Migrants, Lifting of Business Capacity Limits Change Arizona COVID Trends
- COVID-19 in Retreat in Arizona With Vaccines Gaining Traction
- The Ebb and Flow of COVID-19 in Arizona's ICUs
- Arizona's Plunging COVID-19 Caseloads and the Vaccines
- Arizona Enters Downward Trend for COVID-19 After Second Peak
- Arizona Passes Second COVID-19 Peak
- A Tale of Two States and the Coronavirus
- COVID-19 Questions, Answers, and Lessons Learned from Arizona
- The Deadly Intersection of Anti-Police Protests and COVID-19
- 2020 Campaign Events Drive Surge in Arizona COVID Cases
- Arizona Arrives at Critical Junction for Coronavirus Cases
- Arizona To Soon Reach A Critical Junction For COVID-19
- Getting More Than Care from Arizona's COVID ICU Beds
- Arizona's Decentralized Approach to Beating COVID
- Going Back to School with COVID-19
- Arizona Turns Second Corner Toward Crushing Coronavirus
- Arizona's Coronavirus Crest in Rear View Mirror
- The Coronavirus Turns a Corner in Arizona
- A Delayed First Wave Crests in the U.S. and a Second COVID-19 Wave Arrives
- The Coronavirus in Arizona
- A Closer Look at COVID-19 Deaths in Arizona
- The New Epicenter of COVID-19 in the U.S.
- How Long Does a Serious COVID Infection Typically Last?
- How Deadly is the COVID-19 Coronavirus?
- Governor Cuomo and the Coronavirus Models
- How Do False Test Outcomes Affect Estimates of the True Incidence of Coronavirus Infections?
- How Fast Could China's Coronavirus Spread?
References
Political Calculations has been following Arizona's experience with the coronavirus experience from almost the beginning, because the state makes its high quality data publicly available. Specifically, the state's Departent of Health Services reports the number of cases by date of test sample collection, the number of hospitalizations by date of hospital admission, and the number of deaths by date recorded on death certificates.
This data, combined with what we know of the typical time it takes to progress to each of these milestones, makes it possible to track the state's daily rate of incidence of initial exposure to the variants of the SARS-CoV-2 coronavirus using back calculation methods. Links to that data and information about how the back calculation method works are presented below:
Arizona Department of Health Services. COVID-19 Data Dashboard: Vaccine Administration. [Online Database]. Accessed 12 December 2021.
Stephen A. Lauer, Kyra H. Grantz, Qifang Bi, Forrest K. Jones, Qulu Zheng, Hannah R. Meredith, Andrew S. Azman, Nicholas G. Reich, Justin Lessler. The Incubation Period of Coronavirus Disease 2019 (COVID-19) From Publicly Reported Confirmed Cases: Estimation and Application. Annals of Internal Medicine, 5 May 2020. https://doi.org/10.7326/M20-0504.
U.S. Centers for Disease Control and Prevention. COVID-19 Pandemic Planning Scenarios. [PDF Document]. 10 September 2020.
More or Less: Behind the Stats. Ethnic minority deaths, climate change and lockdown. Interview with Kit Yates discussing back calculation. BBC Radio 4. [Podcast: 8:18 to 14:07]. 29 April 2020.
Labels: coronavirus, data visualization
Arizona is seeing an upswing in the number of COVID cases in the state. As best as we can tell using the back calculation method, the new uptrend for cases began with a change in the rate of incidence of exposure to the viral infection approximately between 8 October and 11 October 2021. The following chart shows the latest trends for the number of COVID cases, hospital admissions, and deaths indexed to the approximate date of when those infected were initially exposed to the variants of the SARS-CoV-2 coronavirus being transmitted within the state.

The state's detailed data for hospital admissions and deaths is still as yet too incomplete to tell if they will follow the pattern for the uptrend in cases. The impact of the COVID vaccines combined with improved treatments however has clearly made COVID less serious than it was during 2020.
The period of 8 October through 11 October 2021 was characterized by what might be considered several mass exposure events within the state. Here's a sampling of sporting events that drew thousands in attendance to each:
- Suns run open practice with thousands in attendance; Booker talks NBA 75 shoot
- Arizona falls to UCLA, extending losing skid to 17 straight; QB Jordan McCloud injured
- ASU football rides hot offensive start, take down Stanford
- Cardinals earn forgettable win over 49ers to stay atop NFC West
That's just the sporting events in the state during that period, without including things like tailgate parties or other social gatherings that could constitute significant exposure events.
We were curious to see if Arizona's COVID data could provide more insight into where cases are now arising in the state. The following image is a snapshot of COVID cases by ZIP code in the state, where the darker red the color, the greater the number of cases in the last month.

The map is fascinating because with a few exceptions it shows the higher levels of new COVID cases in ZIP codes are taking place in regions that might be considered to be the suburbs and exurbs of the Phoenix and Tucson metropolitan areas. Here's the short list of the ZIP codes that became the darkest red during the past month:
- 85706: 793 cases
- 85142: 792 cases
- 85338: 792 cases
- 85345: 771 cases
- 85326: 763 cases
- 85122: 717 cases
- 85009: 713 cases
It would be interesting to see if those testing positive for COVID-19 infections in these ZIP codes share any common characteristics. Arizona's public data for infections at this level however doesn't provide enough detail to tell.
Previously on Political Calculations
Here is our previous coverage of Arizona's experience with the coronavirus pandemic, presented in reverse chronological order.
- Arizona's COVID Hospital Admissions Unexpectedly Plunge
- All Indicators Confirm COVID Third Wave Receding in Arizona
- Arizona's Third COVID Wave Peaks and Begins to Recede
- Arizona COVID Cases Rising in Third Wave
- Arizona COVID Cases on Slow Uptrend in Summer 2021
- Increase in Arizona COVID Cases from Border Migration Crisis Stabilizing
- COVID-19 and the 2021 Border Migration Crisis in Arizona
- Improving COVID Trends Bottom and Flatline in Arizona
- Surge of Migrants, Lifting of Business Capacity Limits Change Arizona COVID Trends
- COVID-19 in Retreat in Arizona With Vaccines Gaining Traction
- The Ebb and Flow of COVID-19 in Arizona's ICUs
- Arizona's Plunging COVID-19 Caseloads and the Vaccines
- Arizona Enters Downward Trend for COVID-19 After Second Peak
- Arizona Passes Second COVID-19 Peak
- A Tale of Two States and the Coronavirus
- COVID-19 Questions, Answers, and Lessons Learned from Arizona
- The Deadly Intersection of Anti-Police Protests and COVID-19
- 2020 Campaign Events Drive Surge in Arizona COVID Cases
- Arizona Arrives at Critical Junction for Coronavirus Cases
- Arizona To Soon Reach A Critical Junction For COVID-19
- Getting More Than Care from Arizona's COVID ICU Beds
- Arizona's Decentralized Approach to Beating COVID
- Going Back to School with COVID-19
- Arizona Turns Second Corner Toward Crushing Coronavirus
- Arizona's Coronavirus Crest in Rear View Mirror
- The Coronavirus Turns a Corner in Arizona
- A Delayed First Wave Crests in the U.S. and a Second COVID-19 Wave Arrives
- The Coronavirus in Arizona
- A Closer Look at COVID-19 Deaths in Arizona
- The New Epicenter of COVID-19 in the U.S.
- How Long Does a Serious COVID Infection Typically Last?
- How Deadly is the COVID-19 Coronavirus?
- Governor Cuomo and the Coronavirus Models
- How Do False Test Outcomes Affect Estimates of the True Incidence of Coronavirus Infections?
- How Fast Could China's Coronavirus Spread?
References
Political Calculations has been following Arizona's experience with the coronavirus experience from almost the beginning, because the state makes its high quality data publicly available. Specifically, the state's Departent of Health Services reports the number of cases by date of test sample collection, the number of hospitalizations by date of hospital admission, and the number of deaths by date recorded on death certificates.
This data, combined with what we know of the typical time it takes to progress to each of these milestones, makes it possible to track the state's daily rate of incidence of initial exposure to the variants of the SARS-CoV-2 coronavirus using back calculation methods. Links to that data and information about how the back calculation method works are presented below:
Arizona Department of Health Services. COVID-19 Data Dashboard: Vaccine Administration. [Online Database]. Accessed 15 November 2021.
Stephen A. Lauer, Kyra H. Grantz, Qifang Bi, Forrest K. Jones, Qulu Zheng, Hannah R. Meredith, Andrew S. Azman, Nicholas G. Reich, Justin Lessler. The Incubation Period of Coronavirus Disease 2019 (COVID-19) From Publicly Reported Confirmed Cases: Estimation and Application. Annals of Internal Medicine, 5 May 2020. https://doi.org/10.7326/M20-0504.
U.S. Centers for Disease Control and Prevention. COVID-19 Pandemic Planning Scenarios. [PDF Document]. 10 September 2020.
More or Less: Behind the Stats. Ethnic minority deaths, climate change and lockdown. Interview with Kit Yates discussing back calculation. BBC Radio 4. [Podcast: 8:18 to 14:07]. 29 April 2020.
Labels: coronavirus
Welcome to the blogosphere's toolchest! Here, unlike other blogs dedicated to analyzing current events, we create easy-to-use, simple tools to do the math related to them so you can get in on the action too! If you would like to learn more about these tools, or if you would like to contribute ideas to develop for this blog, please e-mail us at:
ironman at politicalcalculations
Thanks in advance!
Closing values for previous trading day.
This site is primarily powered by:

CSS Validation

RSS Site Feed

JavaScript
The tools on this site are built using JavaScript. If you would like to learn more, one of the best free resources on the web is available at W3Schools.com.
Other Cool Resources
Blog Roll


