When we last checked up on Arizona's experience with the coronavirus pandemic a month ago, we confirmed a new uptrend in cases had begun. We had tracked the timing of the origins of that new upswing to the weekend of 8 October through 11 October 2021, coinciding with multiple high attendance sporting events in the state.
A month later, that upswing is showing signs of peaking. The following chart shows the latest trends for the number of COVID cases, hospital admissions, and deaths indexed to the approximate date of when those infected were initially exposed to the variants of the SARS-CoV-2 coronavirus being transmitted within the state.

The state's detailed data for both hospital admissions and deaths has followed the pattern for the uptrend in cases. However, with compared with the pre-COVID vaccine era for the pandemic, we confirm lower rates of new hospital admissions and deaths with respect to the number of recorded cases in the period with the vaccines widely available and improved treatments.
Arizona however is facing a new challenge: a dwindling supply of Intensive Care Unit beds. The next chart shows the situation that has developed over the past month:

Unlike in 2020, Arizona's hospitals have sought to avoid clearing their ICU units to dedicate space exclusively for COVID patients in 2021. However, the rising number of cases in the latest upswing has led to several ICUs in the state nearing their capacities.
For the first time this entire pandemic, Arizona hospitals have less than 80 total ICU beds available. At Valleywise Health, a spokesperson confirmed there are currently three available. But some medical professionals are worried that things will only get worse the deeper we head into winter. "If we can feel the heat already, then we're already at a level where people should be mindful and doing what they can," Valleywise district medical group vice-chair of surgery Dr. Ross Goldberg said.
With only three ICU beds available, Goldberg and the rest of his staff are preparing for a scenario where that number gets even lower. But he's holding out hope that never happens. "We are constantly watching our situation," Goldberg said. "We are allocating resources as needed to make sure we're getting people taken care of. But again, we don't want to find what those breaking points are. We don't really want to stress the system to that level."
Across Arizona hospitals, ICU bed availability is either at zero or approaching that number. At Flagstaff Medical Center, the only Level I trauma center north of Maricopa County, they are currently at ICU capacity with a waiting list. But if someone shows up needing an ICU bed, a hospital spokesperson confirmed to Arizona's Family that they will be provided with one.
In December 2020, media reports that Arizona's hospital ICU capacity was becoming scarce helped contribute to a positive development in the state's COVID trends. With signs the latest uptrend in cases is already peaking, we may see a similar development in the weeks ahead.
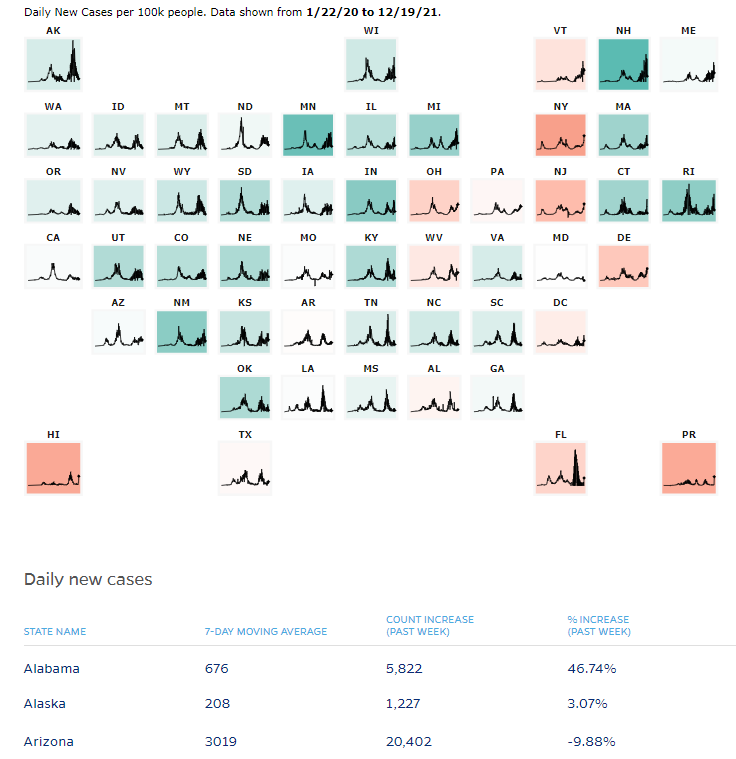
Update 21 December 2021: Data tracking from Johns Hopkins confirms Arizona's new cases have peaked. Here's their chart showing state-by-state trends as of 19 December 2021, where Arizona's new case count has dropped by almost 10% during the previous seven days:
On the plus side, major sport leagues in the U.S. are now postponing games in the recognition their large attendance events are contributing to adverse trends for COVID, as our analysis indicates they did starting from early-October 2021 to cause Arizona's most recent upswing in cases. We may also have been the first analysts to directly make that connection in the new wave of cases in the U.S.
Previously on Political Calculations
Here is our previous coverage of Arizona's experience with the coronavirus pandemic, presented in reverse chronological order.
- Upswing in Arizona COVID Cases Shows Signs of Peaking, Crowded ICUs
- COVID-19 Cases on Upswing in Arizona
- Arizona's COVID Hospital Admissions Unexpectedly Plunge
- All Indicators Confirm COVID Third Wave Receding in Arizona
- Arizona's Third COVID Wave Peaks and Begins to Recede
- Arizona COVID Cases Rising in Third Wave
- Arizona COVID Cases on Slow Uptrend in Summer 2021
- Increase in Arizona COVID Cases from Border Migration Crisis Stabilizing
- COVID-19 and the 2021 Border Migration Crisis in Arizona
- Improving COVID Trends Bottom and Flatline in Arizona
- Surge of Migrants, Lifting of Business Capacity Limits Change Arizona COVID Trends
- COVID-19 in Retreat in Arizona With Vaccines Gaining Traction
- The Ebb and Flow of COVID-19 in Arizona's ICUs
- Arizona's Plunging COVID-19 Caseloads and the Vaccines
- Arizona Enters Downward Trend for COVID-19 After Second Peak
- Arizona Passes Second COVID-19 Peak
- A Tale of Two States and the Coronavirus
- COVID-19 Questions, Answers, and Lessons Learned from Arizona
- The Deadly Intersection of Anti-Police Protests and COVID-19
- 2020 Campaign Events Drive Surge in Arizona COVID Cases
- Arizona Arrives at Critical Junction for Coronavirus Cases
- Arizona To Soon Reach A Critical Junction For COVID-19
- Getting More Than Care from Arizona's COVID ICU Beds
- Arizona's Decentralized Approach to Beating COVID
- Going Back to School with COVID-19
- Arizona Turns Second Corner Toward Crushing Coronavirus
- Arizona's Coronavirus Crest in Rear View Mirror
- The Coronavirus Turns a Corner in Arizona
- A Delayed First Wave Crests in the U.S. and a Second COVID-19 Wave Arrives
- The Coronavirus in Arizona
- A Closer Look at COVID-19 Deaths in Arizona
- The New Epicenter of COVID-19 in the U.S.
- How Long Does a Serious COVID Infection Typically Last?
- How Deadly is the COVID-19 Coronavirus?
- Governor Cuomo and the Coronavirus Models
- How Do False Test Outcomes Affect Estimates of the True Incidence of Coronavirus Infections?
- How Fast Could China's Coronavirus Spread?
References
Political Calculations has been following Arizona's experience with the coronavirus experience from almost the beginning, because the state makes its high quality data publicly available. Specifically, the state's Departent of Health Services reports the number of cases by date of test sample collection, the number of hospitalizations by date of hospital admission, and the number of deaths by date recorded on death certificates.
This data, combined with what we know of the typical time it takes to progress to each of these milestones, makes it possible to track the state's daily rate of incidence of initial exposure to the variants of the SARS-CoV-2 coronavirus using back calculation methods. Links to that data and information about how the back calculation method works are presented below:
Arizona Department of Health Services. COVID-19 Data Dashboard: Vaccine Administration. [Online Database]. Accessed 12 December 2021.
Stephen A. Lauer, Kyra H. Grantz, Qifang Bi, Forrest K. Jones, Qulu Zheng, Hannah R. Meredith, Andrew S. Azman, Nicholas G. Reich, Justin Lessler. The Incubation Period of Coronavirus Disease 2019 (COVID-19) From Publicly Reported Confirmed Cases: Estimation and Application. Annals of Internal Medicine, 5 May 2020. https://doi.org/10.7326/M20-0504.
U.S. Centers for Disease Control and Prevention. COVID-19 Pandemic Planning Scenarios. [PDF Document]. 10 September 2020.
More or Less: Behind the Stats. Ethnic minority deaths, climate change and lockdown. Interview with Kit Yates discussing back calculation. BBC Radio 4. [Podcast: 8:18 to 14:07]. 29 April 2020.
Labels: coronavirus, data visualization
Welcome to the blogosphere's toolchest! Here, unlike other blogs dedicated to analyzing current events, we create easy-to-use, simple tools to do the math related to them so you can get in on the action too! If you would like to learn more about these tools, or if you would like to contribute ideas to develop for this blog, please e-mail us at:
ironman at politicalcalculations
Thanks in advance!
Closing values for previous trading day.
This site is primarily powered by:
CSS Validation

RSS Site Feed
JavaScript
The tools on this site are built using JavaScript. If you would like to learn more, one of the best free resources on the web is available at W3Schools.com.
Other Cool Resources
Blog Roll


