China's fossil fuel shortage has fully reversed. Thanks largely to what is now being described in the media as a "record coal spree", the country is described as now having adequate supplies to get through the winter.
The Chinese government's "coal spree" has produced some stunning numbers for coal imports and domestic production. China's imports of coal sharply increased in 2021, as its imports dipped in December 2021 after peaking in November 2021 as China's domestic coal production soared.
China's fossil fuel shortage prompted officials to crank up domestic coal mining, resulting in record output from coal mines in both December 2021 and for the entire calendar year.
China’s coal output hit record highs in December and in the full year of 2021, as the government continued to encourage miners to ramp up production to ensure sufficient energy supplies in the winter heating season.
China, the world’s biggest coal miner and consumer, produced 384.67 million tonnes of the fossil fuel last month, up 7.2% year-on-year, data from the National Bureau of Statistics showed on Monday. This compared with a previous record of 370.84 million tonnes set in November.
For the full year of 2021, output touched a record 4.07 billion tonnes, up 4.7% on the previous year.
Since October, authorities have ordered coal miners to run at maximum capacity to tame red-hot coal prices and prevent a recurrence of September’s nationwide power crunch that disrupted industrial operations and added to factory gate inflation.
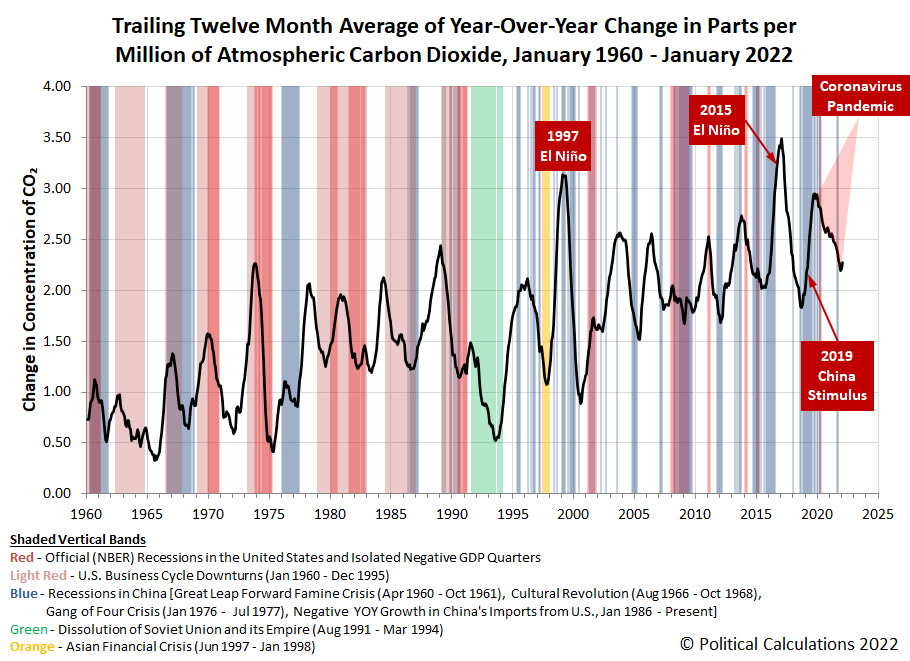
China hasn't let the additional coal it has bought and mined in panic sit around. Chinese power plants have been burning it in great quantities, which has resulted in a very noticable increase in the rate at which carbon dioxide is accumulating in the Earth's atmosphere.
Given its coincidental timing with the waning of the global coronavirus pandemic, the environmental impact of China burning the coal it acquired through it's coal spree may also finally mark the bottom of the coronavirus pandemic itself.
Since we happen to be at an anniversary date for the data, we'll close by presented an updated version of this chart, which spans back to January 1960 to provide additional historic context.
References
National Oceanographic and Atmospheric Administration. Earth System Research Laboratory. Mauna Loa Observatory CO2 Data. [Text File]. Updated 8 February 2022. Accessed 8 February 2022.
Labels: coronavirus, economics, environment
Welcome to the blogosphere's toolchest! Here, unlike other blogs dedicated to analyzing current events, we create easy-to-use, simple tools to do the math related to them so you can get in on the action too! If you would like to learn more about these tools, or if you would like to contribute ideas to develop for this blog, please e-mail us at:
ironman at politicalcalculations
Thanks in advance!
Closing values for previous trading day.
This site is primarily powered by:
CSS Validation
RSS Site Feed
JavaScript
The tools on this site are built using JavaScript. If you would like to learn more, one of the best free resources on the web is available at W3Schools.com.

