There is a surprising story that is flying under the radar in almost all of the reporting on the United States' trade with China in April 2017. To see what we mean, here is are some key excerpts from a recent news report following the U.S. Census Bureau's reporting of its foreign trade balance data for the month (emphasis ours):
The U.S. trade deficit widened more than expected in April amid a surge in cellphone imports, suggesting trade could be a drag on economic growth in the second quarter....
Exports to China increased 2.2 percent, but the value of goods shipped to Mexico and Canada dropped 10.3 percent and 9.0 percent, respectively. Exports to Germany tumbled 13.3 percent....
Imports of goods and services increased 0.8 percent to $238.6 billion. Cellphone imports jumped $1.8 billion, accounting for the bulk of the increase in consumer goods imports. Imports of industrial supplies, however, fell $1.5 billion, with crude oil imports declining $1.9 billion.
The country imported 229 million barrels of oil in April, the smallest amount since October 2016. Imports of goods from China jumped 9.6 percent. Imports from Germany fell 4.1 percent.
The politically sensitive U.S.-China trade deficit increased 12.4 percent to $27.6 billion in April, while the trade gap with Germany rose 4.3 percent to $5.5 billion.
We selected these particular excerpts because we want to focus in on two aspects of the reporting.
- The trade balance between the U.S. and China.
- Oil imports and exports.
If you read the article in full, you would never know that U.S. exports to China increased in April 2017 by 20.8% over their April 2016 level, which is faster that the 13.6% year over year rate of growth for China's exports to the U.S.
Despite the U.S.' faster rate of export growth, the U.S.-China trade deficit widened because the base value of the goods and services that China exports to the U.S. is nearly four times as large as the value of what the U.S. exports to China. If however the U.S. can continue to grow its exports to China at a faster rate than it grows its imports, that gap will narrow.
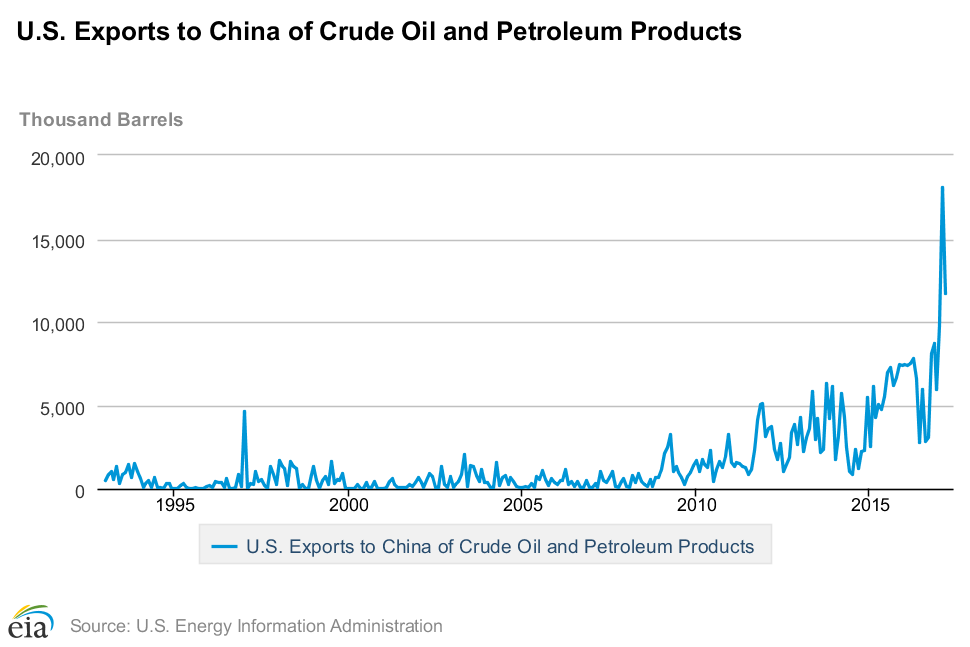
That brings us to oil, which has recently become a major export product for the U.S. economy, where China is becoming a very large consumer. [If you're reading this article on a site that republishes our RSS news feed, please either click here to access a static copy of the interactive image showing the volume of oil exported from the U.S. to China in each month from January 1993 through March 2017 below, or just click through to the version of the article that appears our site.]
If you go back to the article we quoted at the beginning of this analysis, since it only discusses U.S. oil imports without any mention of U.S. oil exports, you might never know that that increased U.S. exports of oil to China accounted for 43% of the $1.2 billion year over year increase in the value of the U.S.' total exports to that nation for April 2017.
And that's the hidden story in U.S.-China trade. In becoming a major oil-exporting nation over the last year, the U.S. has the means to significantly shrink its trade deficit with China, thanks to that nation's growing appetite as the world's largest consumer of petroleum and other hydrocarbon products, where oil has the potential to replace soybeans as the U.S.' top export product to China.
That new trade can also provide a more direct indication of the relative health of China's economy, which we'll explore in greater detail in the future.
Data Sources
U.S. Census Bureau. Trade in Goods with China. Accessed 5 June 2017.
Board of Governors of the Federal Reserve System. China / U.S. Foreign Exchange Rate. G.5 Foreign Exchange Rates. Accessed 5 June 2017.
Energy Information Administration. U.S. Exports to China of Crude Oil and Petroleum Products (Thousand Barrels). [Online Database]. Accessed 5 June 2017.
Labels: trade
Welcome to the blogosphere's toolchest! Here, unlike other blogs dedicated to analyzing current events, we create easy-to-use, simple tools to do the math related to them so you can get in on the action too! If you would like to learn more about these tools, or if you would like to contribute ideas to develop for this blog, please e-mail us at:
ironman at politicalcalculations
Thanks in advance!
Closing values for previous trading day.
This site is primarily powered by:
CSS Validation
RSS Site Feed
JavaScript
The tools on this site are built using JavaScript. If you would like to learn more, one of the best free resources on the web is available at W3Schools.com.

