U.S. imports of goods produced in China collapsed further in November 2022, continuing the plunge that began in September.
The following chart shows the year-over-year growth rate of the value of goods imported from China to the U.S. has collapsed into negative territory, confirming U.S. imports are shrinking.
We dug into the Census Bureau's detailed data on goods traded between the U.S. and China during November 2022. We found three categories of goods account for the bulk of the year over year reduction in goods imported from China. Here is the list:
- Electric Machinery (primarily Smartphones, Monitors, and Electrical Heating Devices)
- Automatic Data Processing Machines
- Toys (not including Video Game Consoles)
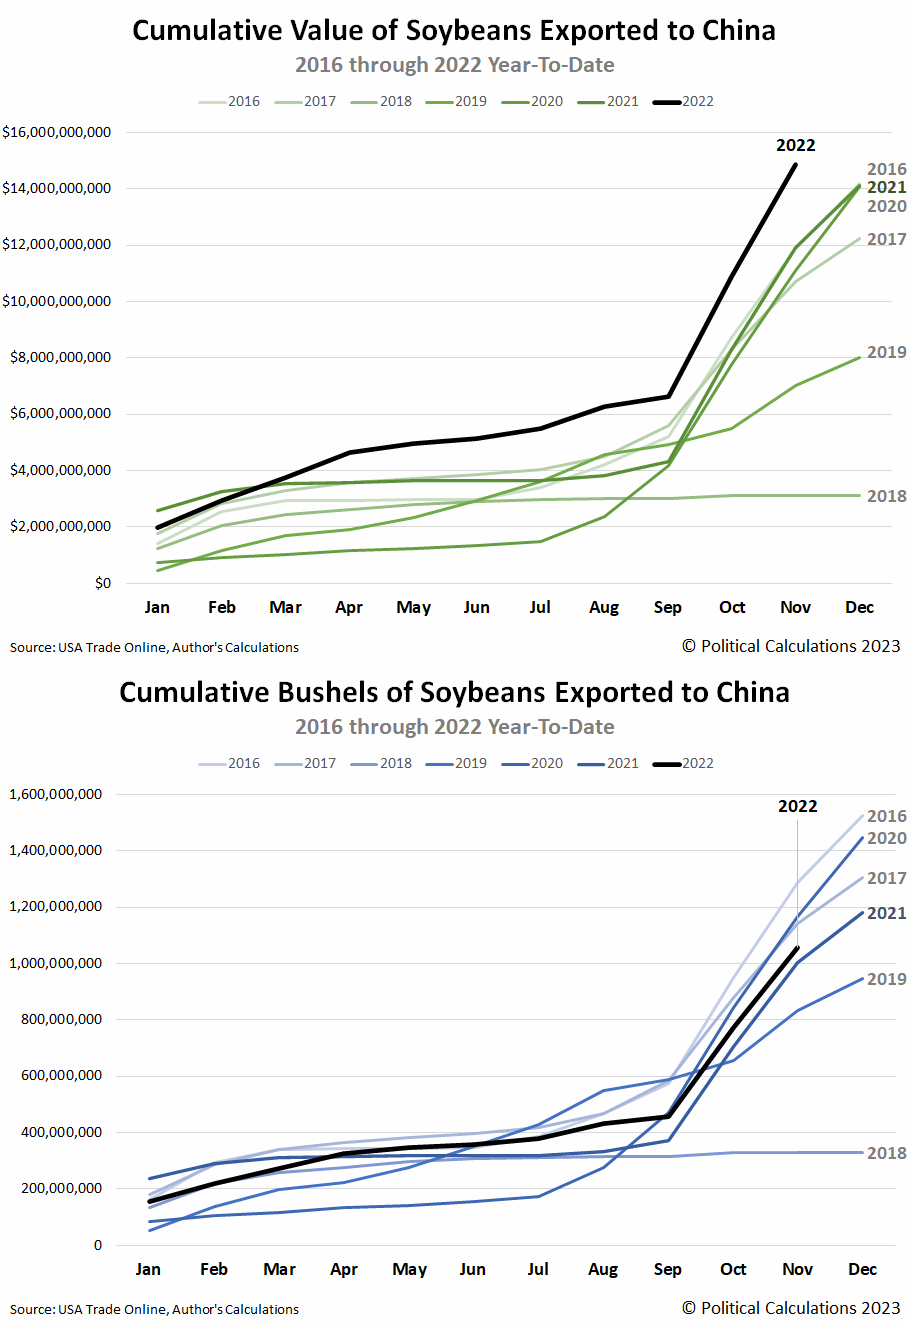
The growth rate chart also shows U.S. exports to China held their single-digit year-over-year growth rate, but even that is misleading. The months of October through December represent the peak season for U.S. exports to China, which is dominated by soybeans. Updating the animated chart we featured last month, we find that while the value of 2022's exports of soybeans is setting new records, in real terms, the volume of soybeans being exported is well below the levels set in 2016, 2017, and 2020.
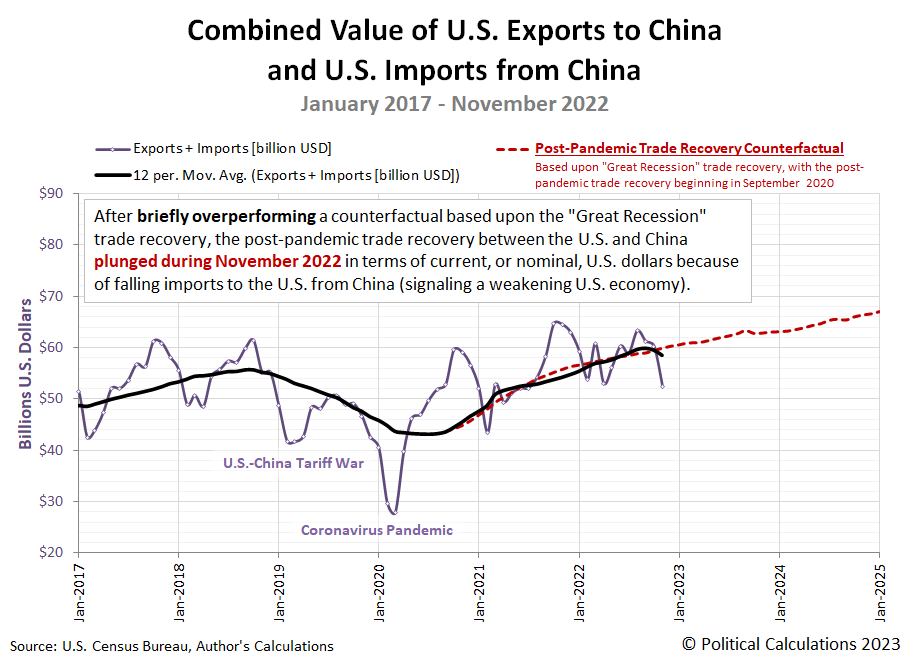
Overall, the continuing collapse of U.S. imports from China has pulled the combined value of goods traded between the U.S. and China below a counterfactual trajectory based on the recovery of trade between the countries after 2008-09 Great Recession. The next chart shows the post-pandemic trade recovery is once again underperforming:
As a general rule, growth trends for imports provide an indication of the relative health of the economy that is importing the goods. In this case, we think it's more an indication that the COVID lockdowns China imposed in October and November severely disrupted its production and export of the goods that saw the biggest year-over-year declines.
China's government was forced to reverse its lockdown policies in December 2022, with most of its restrictions lifted by early January 2023. That timing means we should anticipate at least one more month of negatively impacted imports from China before its government's policy reversal begins to be reflected in the trade data.
On the U.S. side of the trade ledger, we only have December 2022's data to be reported before we can close the books on 2022's soybean export season. After that data is reported in early February 2023, we anticipate U.S. exports to China will plunge since they will no longer be boosted by the inflated value of soybeans. These changes mean that trade between the U.S. and China will transition into a stronger headwind against the U.S. economic growth in 2023.
References
U.S. Census Bureau. Trade in Goods with China. Last updated: 5 January 2023.
U.S. Department of Agriculture. Soybeans - Price Received, Measured in $/bushel. [Online Database]. Accessed 8 January 2023.
U.S. Trade Online. [Online Database]. Accessed: 5 January 2023.
Welcome to the blogosphere's toolchest! Here, unlike other blogs dedicated to analyzing current events, we create easy-to-use, simple tools to do the math related to them so you can get in on the action too! If you would like to learn more about these tools, or if you would like to contribute ideas to develop for this blog, please e-mail us at:
ironman at politicalcalculations
Thanks in advance!
Closing values for previous trading day.
This site is primarily powered by:
CSS Validation
RSS Site Feed
JavaScript
The tools on this site are built using JavaScript. If you would like to learn more, one of the best free resources on the web is available at W3Schools.com.


