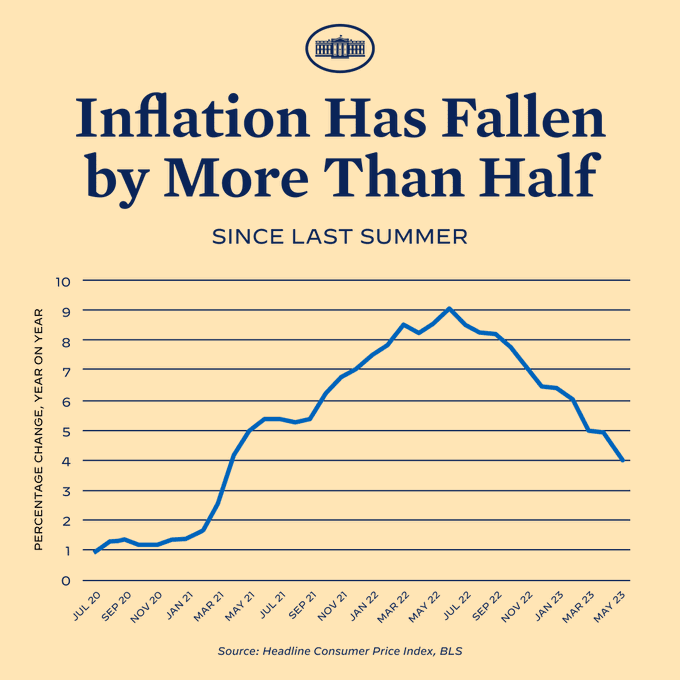
After President Biden signed the American Rescue Plan Act of 2021 into law on 11 March 2021, inflation within the U.S. economy quickly accelerated. Even today, it is well elevated over the range it held in the months prior to the passage of the ARPA stimulus package. The White House recently drove that point home with the following chart it tweeted on 13 June 2023.
That event marked a big change for Americans after four decades of generally falling inflation. It is also remarkable because the U.S. led the rest of the developed world for how quickly its inflation grew as 2020's coronavirus pandemic waned. We've adapted the following chart from Statista to show how much faster the rate of inflation in the United States took off compared to what the developed economies of the Eurozone and Japan experienced in 2021.
After March 2021, the rate of inflation in the U.S. exceeded the European Union's inflation rate by 2.0% or more all the way up until early 2022, and Japan's by 7.0% or more. The E.U.'s inflation rate would only catch up after tensions between Russia and Ukraine built, which then spiked following Russia's invasion of Ukraine on 24 February 2022. That action drove up the price of oil, particularly in the Eurozone, pushing the region's inflation higher than the U.S.
Before the invasion, rising inflation in the U.S. economy was becoming a big political problem. It had both preceded and developed fully independently of Russia's invasion. It also exceeded the inflation happening in other developed economies that could be attributed to supply chain issues related to the economic recovery from the coronvirus pandemic's lockdowns they had implemented. And since neither the governments of the European Union nor Japan had implemented any stimulus measures similar in scope to President Biden's during 2021, the pace at which inflation had increased in the U.S. following the passage of ARPA stands out like a sore thumb compared to these other regions.
Not that was a surprise in any way. Mainstream economists predicted the stimulus checks authorized by the American Rescue Plan Act would cause inflation in the U.S. economy to surge to levels not seen in decades. To counter those arguments, the Biden administration relied on analysis provided by advocates of fringe economic theories to dismiss the concerns raised by mainstream economists to justify their desire to "go big" with the stimulus to achieve their political objectives. Those advocates claimed the big stimulus package they wanted would not lead to high inflation. But the arrival of the inflation they claimed would not occur fully discredited their theories. Both they and the Biden administration needed a scapegoat on which to blame their failure.
They chose American businesses as their target for assigning blame. But not just any American business. All American businesses.
Here's an example of the attempt to shift blame for the U.S. economy's excess inflation from the leading advocate of the Biden administration's "Go Big" stimulus measure:
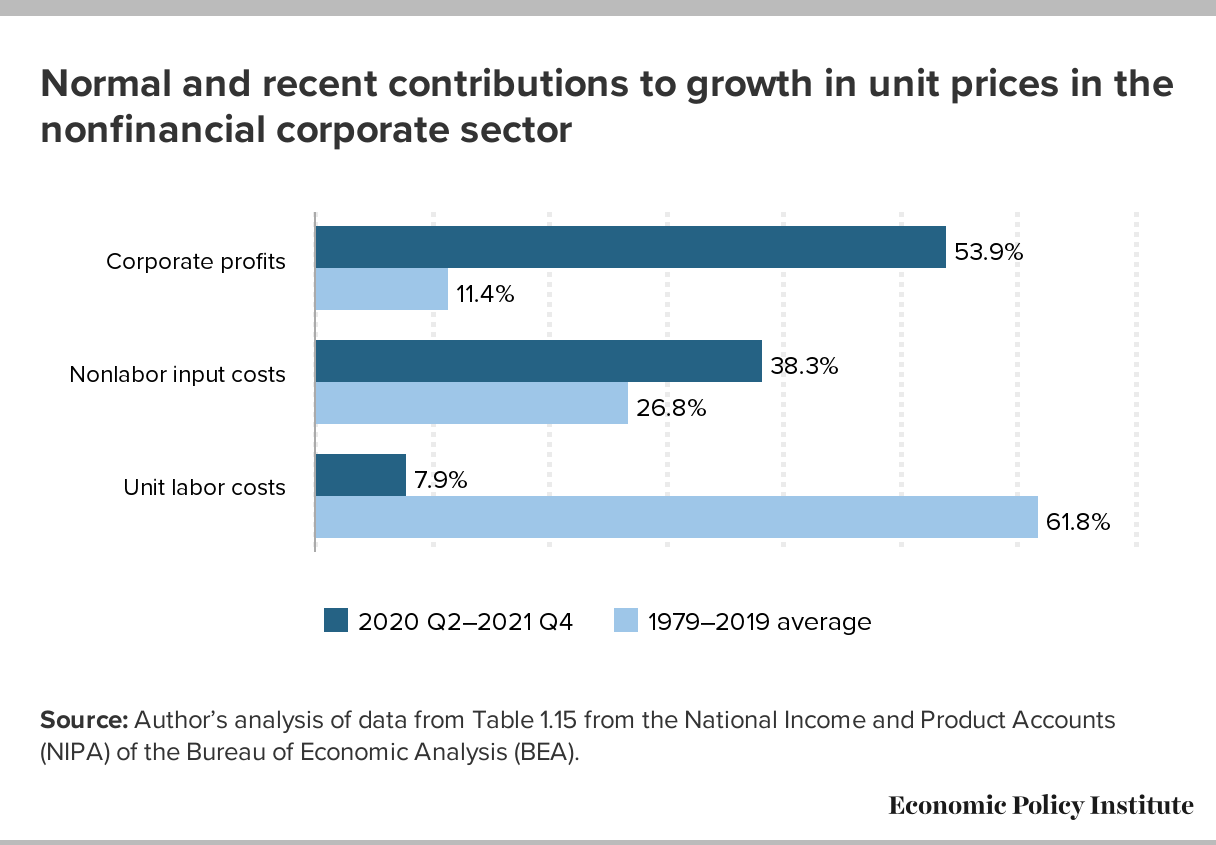
Since the trough of the COVID-19 recession in the second quarter of 2020, overall prices in the NFC sector have risen at an annualized rate of 6.1%—a pronounced acceleration over the 1.8% price growth that characterized the pre-pandemic business cycle of 2007–2019. Strikingly, over half of this increase (53.9%) can be attributed to fatter profit margins, with labor costs contributing less than 8% of this increase. This is not normal. From 1979 to 2019, profits only contributed about 11% to price growth and labor costs over 60%, as shown in Figure A below. Nonlabor inputs—a decent indicator for supply-chain snarls—are also driving up prices more than usual in the current economic recovery.
This concept is marketed by political activists as "greedflation". It's their shorthand for saying "profits cause inflation", by which they seek to place blame for the inflation they claimed would not happen on the hateful greed of American businesses. Unfortunately, this thinking appears based on the fallacy of reasoning from an accounting identity that seems commonly practiced by fringe economists. Brian Albrecht explains why the claim doesn't pass intellectual muster after discussing how the fallacy applies to bad trade theory:
Before we mock the trade deficit people too much (who, in this case, are “conservatives”), there has been a more prominent example in recent years that has generally come from people on the left. It is the idea that profits cause inflation.
After all, any revenue PQ = Costs + Profits. So P = Costs/Q + Profits/Q. If inflation means that P goes up, it must be “caused” by costs or profits.
No, again. Stop it. This is like saying consumption causes income.
Instead, we need to ask, what changed? What actually caused things to be different? Did the Fed print a bunch of money? Then consumer spending will go up, which will drive up prices, costs, and profits. It may be that profits rose more than costs but that’s not a causal relationship. Or did prices rise because of an oil shock? Costs will probably rise, along with prices, but it could be that profits fall enough to offset that. We can do the decomposition, and that’s fun, but let’s not mistake that for economic analysis.
As the fact-checker Politifact notes, "corporate profits do not drive inflation, but inflation boosts company profits". The concept of greedflation itself is not just "inconsistent with standard price theory," it is an out-of-mainstream fringe theory altogether.
But that's not all. A good part of what these economists are calling the "abnormally high contribution of profits to price growth" may be little more than an artifact of the first-in, first out accounting most businesses use to determine their cost of goods sold while calculating their earnings. During periods of high or rising inflation, this accounting method understates the effect rising prices have upon their true cost of doing business. That makes their reported profits on paper seem much larger than they really are.
That's why the analysis provided to support this particular claim of greedflation stands out. Normally, we wouldn't blink at data being evaluated over a 40 year period, but the period of 1979 through 2019 is one in which the rate of inflation has generally fallen in the United States after having reached a very high level. It is both unlike the period following the Coronavirus Pandemic recession of 2020 and the period before 1979. Omitting the earlier period of rising inflation raises questions. How did corporate profits behave during the period of rising inflation that preceded 1979? Do today's corporate profits really stand out as being as abnormal as the greedflationists claim?
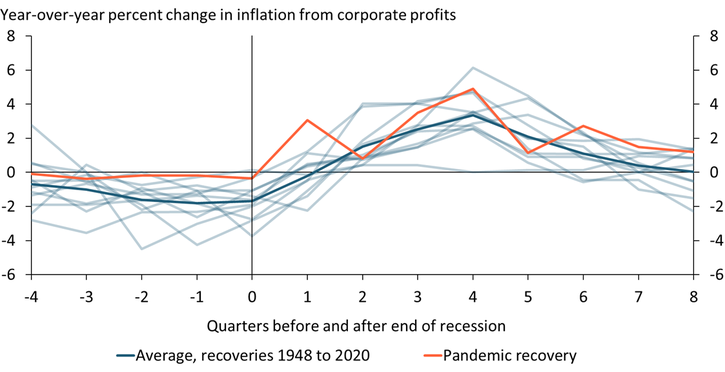
Not according to a new economic bulletin by Andrew Glover, José Mustre-del-Río, and Jalen Nichols of the Federal Reserve Bank of Kansas City. They looked at a much longer historic period that included periods of rising inflation and following recessions in particular. The following chart visualizes their findings:
Here's how they describe what this chart shows:
Corporate profits rose quickly in 2021 along with inflation, raising concerns about corporations driving up prices to increase profits. Although corporate profits indeed contributed to inflation in 2021, their contribution fell in 2022. This pattern is not unusual: in previous economic recoveries, corporate profits were the main contributor to inflation in the first year and displaced by costs in the second year.
Two years (eight quarters) after a recession ends, corporate profits make a relatively small positive contribution to inflation. The orange line shows that there was qualitatively nothing unique about the path of profit-generated inflation during the pandemic recovery.
So if it's not really abnormal and most goes away within two years of the end of a recession, what's really going on? After all, even the Fed's economists seem to think profits are causing inflation, rather than being an outcome of inflation they enabled through their monetary policy. If that's really true, why would such greedflation consistently go away after two years?
What's really happening is pretty boring. Companies start an inflationary period with inventories they accumulated at lower prices. When demand picks up, especially as might be expected when big stimulus checks are sent to millions of Americans, they start consuming their available inventory to meet the increased demand. That consumed inventory then needs to be replaced. When businesses try to replace it, they become part of the extra demand their suppliers are trying to meet and have to do it at higher prices, especially when their suppliers are themselves having trouble keeping up with the increased demand. They respond quickly to that situation by raising their own prices to keep ahead of the higher costs they are paying today and the even higher costs they expect they will have to pay going forward.
While their inexpensively acquired inventory holds out, this scenario leads to elevated profits on paper, particularly during the early period of the recovery. But only temporarily, until all their previously accumulated "cheap" inventory has been fully consumed and it's time to include the higher cost of the replacement inventory in their cost of doing business when reporting their earnings. After that happens, corporate profits on paper start falling back to earth.
Let's take that idea one step further. If corporate greed were really responsible for driving prices up, wouldn't it be easy to find clear evidence for it in corporate financial reports? The Financial Times' Bryce Elder went looking for evidence of greedflation among 1,000 global large-cap companies and came up empty. A handful of companies that on paper seemed to be super-greedy were really coping with extenuating circumstances, while the majority of firms had profit margins close to their historic norms.
A good example of a company that did have booming profits that were really the result of extenuating circumstances is provided by Cal-Maine (NASDAQ: CALM), which was singled out for its "corporate greed" by the former Obama administration Secretary of Labor Robert Reich when its reported profits rocketed up with the price of eggs at the end of 2022.
In reality, egg prices increased as eggs fell into very short supply because of the H5N1 Bird Flu pandemic that prompted the state and federal regulation-mandated culling of 57 million egg-laying hens in the U.S., which greatly shrank the supply of eggs in just a matter of months. A quick review of Cal-Maine's earnings reports provides a clear explanation for why their profits surged: none of their flocks of egg-laying hens had been infected by the bird flu virus. Since then, the population of egg-laying hens has rebounded, increasing the supply of eggs and sending egg prices down, all in a matter of months. As you might expect, Cal-Maine's profits are returning to their typical levels.
You would think greedflation would have more staying power if it were real. You would also think there would be strong evidence to support the claim, but as with sasquatch and yeti sightings, it's hard to find. At best, it's a really skiffy concept to rely upon in attempting to avoid blame and facing the consequences for an easily avoidable "consequential policy error" that reduces the standard of living for millions of Americans.
Bonus: Dan Mitchell finds the most economically illiterate tweet of 2023!
Update 8 July 2023: The New Yorker calls the case for greedflation being advanced by partisan progressives "weak". Meanwhile, the Economist flat out calls greedflation a "nonsense idea"!
References
Josh Bivens. Corporate profits have contributed disproportionately to inflation. How should policymakers respond? Working Economics Blog. [Online Article]. 21 April 2022.
Bryce Elder. The Wealth of Greedflations. FT Alphaville. [Online Article, Google Docs spreadsheet]. 5 April 2023.
Andrew Glover, José Mustre-del-Río, and Jalen Nichols. Corporate Profits Contributed a Lot to Inflation in 2021 but Little in 2022—A Pattern Seen in Past Economic Recoveries. Federal Reserve Bank of Kansas City Economic Bulletin. [PDF Document]. 12 May 2023.
Louis Jacobson. Corporate profits do not drive inflation, but inflation boosts company profits. Politifact. [Online Article]. 9 December 2022.
William J. Luther. The Greedflation Myth. American Institute for Economic Research. [Online Article]. 20 May 2023.
Statista. Monthly inflation rates in developed and emerging countris from January 2021 to April 2023. [Online Application]. Accessed 25 June 2023.
World Bank. Inflation, consumer prices for the United States [FPCPITOTLZGUSA], retrieved from FRED, Federal Reserve Bank of St. Louis. [Online Database]. Accessed 25 June 2023.
Labels: economics, ideas, inflation
Welcome to the blogosphere's toolchest! Here, unlike other blogs dedicated to analyzing current events, we create easy-to-use, simple tools to do the math related to them so you can get in on the action too! If you would like to learn more about these tools, or if you would like to contribute ideas to develop for this blog, please e-mail us at:
ironman at politicalcalculations
Thanks in advance!
Closing values for previous trading day.
This site is primarily powered by:
CSS Validation
RSS Site Feed
JavaScript
The tools on this site are built using JavaScript. If you would like to learn more, one of the best free resources on the web is available at W3Schools.com.


