We've previously discussed our sources for where we obtain the dividend futures data we use to track what investors expect at different points in time of the future, but we haven't shown how they compare with respect to one another, much less to how actual dividends per share play out!
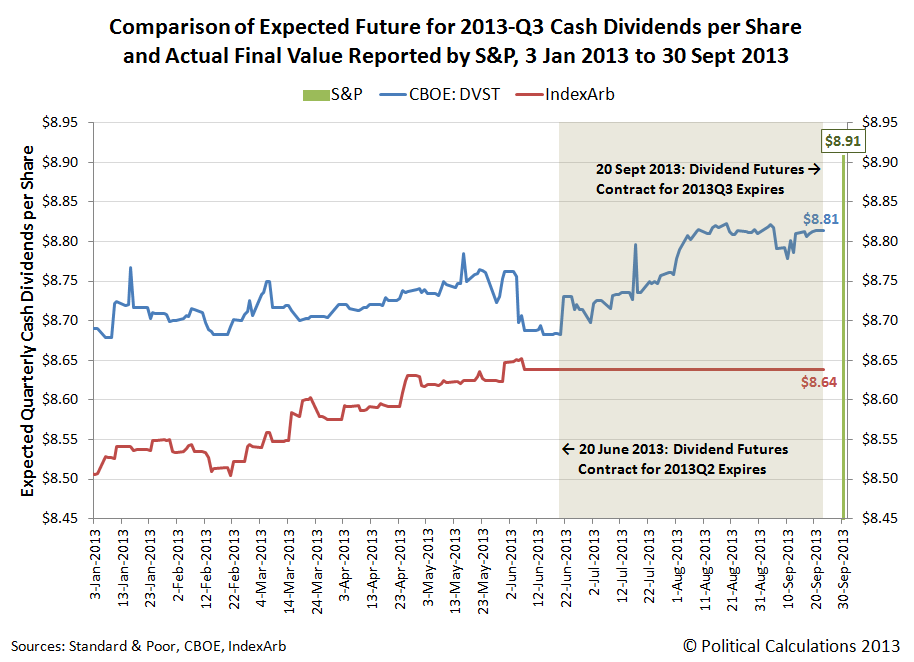
We going to do that today using data for the just-ended third quarter of 2013. Our chart below shows how the data for 2013-Q3's expected cash dividends per share tracked from 3 January 2013 through the end of the calendar quarter on 30 September 2013:
As we noted before, the main difference between our primary sources of dividend futures data is how they determine how much the cash dividends per share will be at the end of the quarter they track. The Chicago Board of Exchange (CBOE) dividend futures contract uses a "top-down" approach, where the price of the contract is set by futures trading activity (if you access their data, the reported value is ten times the expected cash dividends per share for the quarter, so be prepared to shift the decimal point accordingly).
Meanwhile, IndexArb uses a "bottom-up" approach, which takes expected dividend per share data from each of the S&P 500's component companies and weights them according to their market capitalization within the index to create its expected cash dividend per share value. IndexArb also complicates its reporting for future quarters as the information it provides really indicates the total amount of estimated dividends per share for the index that will be paid out between the present (today) and the end of the dividends futures contracts upon which they're based.
That means that to find the expected amount of dividends per share that will be paid out in a given quarter, you have to take the total amount of dividends per share that will be paid out by the end of that quarter and subtract the total amount of dividends per share that will be paid out by the end of the preceding quarter. So, if we want to do find the value for 2013-Q3, we have to subtract the dividends per share that would be paid out by 2013-Q2 from it!
That creates some problems, which you can see in the chart above. Here, the data for 2013-Q3 from IndexArb effectively flatlines at the expiration of the dividend futures contract for 2013-Q2 on the third Friday of June 2013 (21 June 2013), because the futures data for the preceding quarter is no longer available for us to do that subtraction operation.

We can also see differences in how the values start and change over time. Here, the CBOE's dividend futures data starts and a higher value than IndexArb's, but is subject to greater volatility, which you would expect given how its value is set.
The IndexArb data is less volatile, and although it begins at a lower value, we can see that it converges toward the values that the CBOE projects, at least through the end of the preceding quarter's data. Based on the trend we observe in the data before that time, we think that the two would converge very close to each other by the actual expiration of the dividend futures contracts on 20 September 2013.
Meanwhile, both of the expected dividend values for both sources fell short of the actual level of cash dividends per share of $8.909 that S&P reported for 2013-Q3 after the end of the calendar quarter on 30 September 2013.
We think the primary source of the discrepancy between the dividend futures and the actual value for cash dividends per share can be traced to the estimate of each S&P 500 component company's weighting within the index. S&P is the final arbiter of those values, while estimates used by others are just that - estimates. We should also note that there is also a bit of mismatch between the terms of the dividend futures contracts and the dividends that are paid out by the ends of the calendar quarters that S&P reports, which may also account for a good portion of the discrepancy between the futures and the actual data once it is reported.
Given our experience in tracking the data, what we find to be really remarkable that the dividend futures data is typically within a 3% margin of S&P's officially recorded value (that's true even of the three-month earlier cutoff for IndexArb in the absence of a real market-shaking event), and often, is within a much closer margin of error than that.
Speaking of which, since the CBOE data stays "live" longer than the IndexArb data, our next update of our favorite chart will be based solely on the CBOE's data, which we're going to unveil tomorrow. We were going to wait to do that development until our annual end of year hiatus, but it turned out to be a snap to do, and there's some really interesting insights that come out of it!
Image Credit: Schweitz Finance.
Data Sources
EODData. Implied Forward Dividends September (DVST). [Online Database]. Accessed 7 October 2013.
IndexArb. Dividend Analysis. [Online Data Report]. Accessed daily from 3 January 2013 through 21 June 2013.
Standard and Poor. S&P 500 Index Earnings and Estimates. [Excel Spreadsheet]. Accessed 7 October 2013.
Welcome to the blogosphere's toolchest! Here, unlike other blogs dedicated to analyzing current events, we create easy-to-use, simple tools to do the math related to them so you can get in on the action too! If you would like to learn more about these tools, or if you would like to contribute ideas to develop for this blog, please e-mail us at:
ironman at politicalcalculations
Thanks in advance!
Closing values for previous trading day.
This site is primarily powered by:
CSS Validation

RSS Site Feed
JavaScript
The tools on this site are built using JavaScript. If you would like to learn more, one of the best free resources on the web is available at W3Schools.com.
Other Cool Resources
Blog Roll


