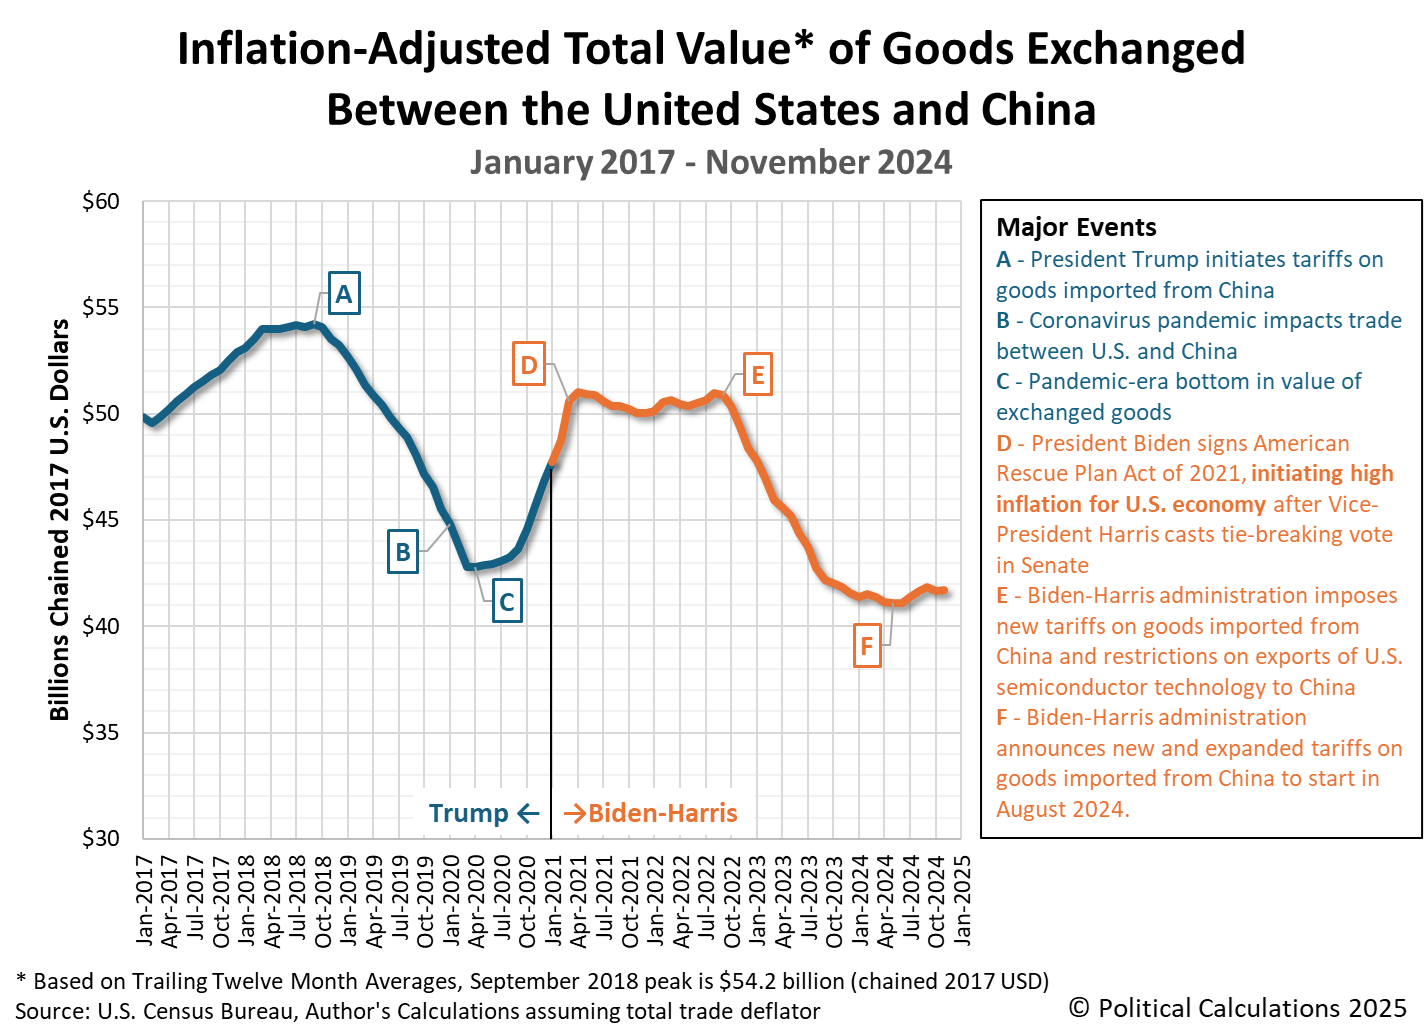
From time to time, we'll try to tell a big story mostly using charts. Today's story is about trade between the U.S. and China during both President Trump's and President Biden's first terms in office. Our first chart presents the inflation-adjusted total value of goods traded between the two nations from January 2017 through November 2024 (the most recent data for which U.S. trade data is available at this writing). The data for President Trump's previous term is indicated in blue, the data for President Biden's current term, which will end on 20 January 2025, is shown in orange, and the given values are in terms of constant 2017 U.S. dollars:
Overall, the value of trade between the U.S. and China has been lower during the Biden-Harris administration than it was during President Trump's first term in office, which is remarkable because President Trump's first term includes both the 2018-19 tariff war that initiated a decline in trade between the two nations starting after September 2018 and also the plunge in trade that accompanied 2020's Coronavirus Pandemic. The Biden-Harris administration achieved that outcome through its own policies. It first broke the recovery in trade between the U.S. and China by unleashing high inflation in March 2021, then crushed trade to new lows with its own anti-free trade restrictions starting after September 2022.
In our second chart, we show how much the inflation-adjusted level of trade between the two nations has changed since September 2018, which marks the peak of trade between the countries before President Trump imposed tariffs against Chinese-produced goods and China retaliated in kind:
The total value of trade between the U.S. and China bottomed at 21% below its September 2018 peak in April 2020 during President Trump's first term in office. Although it recovered all but 6% of that loss in the recovery that followed, it stagnated after March 2021 before plunging again after September 2022. The total value of trade between the U.S. and China bottomed at more than 24% below its September 2018 peak in May 2024 and now sits at 23% below that peak, at least through November 2024.
There's a unique symmetry in the anti-China trade actions taken by President Trump and President Biden, in that the most negative anti-free trade actions they initiated were announced in September of each their second year in office. In our third and final chart, we've set September 2018 as Month 0 for President Trump's trade actions and September 2022 as Month 0 for President Biden's to produce a direct side-by-side comparison that will span identical periods of time following their pre-trade restriction peaks.
Aligning the data this way produces an unambiguous answer to the question of which President's trade-specific policies have been more damaging for trade between the U.S. and China. President Biden's policies have sustained a more negative outcome than President Trump's first-term policies. Was that the answer you expected?
References
U.S. Census Bureau. U.S. International Trade in Goods and Services (FT900). U.S. Trade in Goods with China, Not Seasonally Adjusted, Nominal Figures, Total Census Basis. [Online database]. Accessed 14 January 2025.
U.S. Census Bureau. U.S. International Trade in Goods and Services (FT900). U.S. Trade in Goods with World, Seasonally Adjusted, Nominal Figures, Total Census Basis. [Excel spreadsheet]. Accessed 14 January 2025.
U.S. Census Bureau. U.S. International Trade in Goods and Services (FT900). Real U.S. Trade in Goods with World, Seasonally Adjusted, Chained 2017 U.S. Dollars, Total Census Basis. [Excel spreadsheet]. Accessed 14 January 2025.
Labels: trade
Welcome to the blogosphere's toolchest! Here, unlike other blogs dedicated to analyzing current events, we create easy-to-use, simple tools to do the math related to them so you can get in on the action too! If you would like to learn more about these tools, or if you would like to contribute ideas to develop for this blog, please e-mail us at:
ironman at politicalcalculations
Thanks in advance!
Closing values for previous trading day.
This site is primarily powered by:
CSS Validation
RSS Site Feed
JavaScript
The tools on this site are built using JavaScript. If you would like to learn more, one of the best free resources on the web is available at W3Schools.com.


