Political Calculations
May 23, 2006

For no other reason than I have all this data and because I can, I thought it might be fun to take a look at the distribution of losing streaks for the S&P 500 index since 1871!

By counting up the number of periods where the S&P 500 index produced a negative annualized nominal rate of return for a given number of years of duration, I was able to create the following chart, which shows the number of periods between January 1871 and December 2005 where the S&P 500 was "under water":

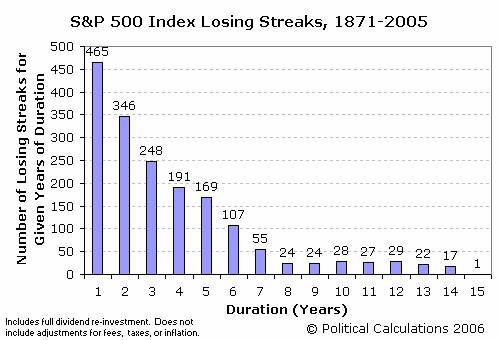
The data behind the chart above assumes full dividend re-investment, but does not take inflation, taxes or fees into account, all of which would increase the number of periods indicated since these factors eat away at the market's rate of return.

The following table shows the number of periods taken into account for each number of years of losing streak duration. A period consists of a full-year increment of time beginning in any month following January 1871. (Note: there were no losing streaks, in nominal terms, after 15 years!)

Number of Periods for Given Years of Duration
Duration (Years) Number of Periods Duration (Years) Number of Periods Duration (Years) Number of Periods
11,608 61,548 111,488
21,596 71,536 121,476
31,584 81,524 131,464
41,572 91,512 141,452
51,560 101,500 151,440

The Longest Losing Streaks

The longest losing streak of 15 years, which has only occurred once in the time since 1871, coincides with the Great Stock Market Crash of October 1929, where an investor who began investing in the preceding month of September, when the market reached its pre-depression era peak, was truly in for a rough ride.

Likewise, all the periods where market losses extended for 10 years or more are clustered between March 1928 and April 1931.

Labels: ,


<< Home
Unexpectedly Intriguing!

About Political Calculations


blog advertising
is good for you

Welcome to the blogosphere's toolchest! Here, unlike other blogs dedicated to analyzing current events, we create easy-to-use, simple tools to do the math related to them so you can get in on the action too! If you would like to learn more about these tools, or if you would like to contribute ideas to develop for this blog, please e-mail us at:

ironman at politicalcalculations.com

Thanks in advance!

Most Popular Posts

The S&P 500 at Your Fingertips

Mapping S&P 500 Performance, Since 1871

Should You Trade In Your Gas Guzzler?

What Are the Chances Your Marriage Will Last?

Reckoning the Odds of Recession

Your 2009 Paycheck

Tipping Around the World

Revisiting the Lottery

Estimating Your Life Expectancy

Connecting the Dots for Personal Income Taxes

Quick Index

First Time Visitor to Political Calculations?

On the Moneyed Midways

A Lot, But Not All, of Our Tools

Recent Posts

The Money Factor in Leasing

On the Moneyed Midways - May 19, 2006

Moneychimp's Evolved Tools

S&P 500: Best, Average and Worst Returns Since 187...

Mapping S&P 500 Performance, Since 1871

On the Moneyed Midways - May 12, 2006

Real Medical Notes For Sale!

On the Moneyed Midways – May 5, 2006

Simply Freaky

Thinking Again About Taxing "Big Oil"

Recession Probability Track

Recession Probability Track - 22 December 2005 through 22 December 2009

Political Calculations' Recession Probability Track shows the probability that the U.S. economy will be in recession 12 months from the indicated date (shown in red) while revealing the probability trend over the past four years.

Previously, the probability of recession peaked at 50% on 4 April 2007, which means that March-April 2008 was the most likely period in which the NBER would have found the U.S. to be in recession.

As it happens, they almost did. The NBER instead chose December 2007 as the beginning month of the most recent recession (we had found a 46% probability for a recession beginning in that month!)

On the Moneyed Midways

Political Calculations is also the online home of On the Moneyed Midways (aka OMM), a review of the best posts contributed to the week's best business and money-related blog carnivals. More than that, we also name one post in each edition as being The Best Post of the Week, Anywhere! and at the end of each year, we name The Best Post of the Year, Anywhere! as well as identifying the best blogs we found during the course of the year!

The link below will take you to the running index containing our most recent back issues (you can easily navigate the index to find older editions.)

OMM's Running Index for 2008

Site Data

This site is primarily powered by:

This page is powered by Blogger. Isn't yours?

Visitors since December 6, 2004:

TTLB Ecosystem

CSS Validation

Valid CSS!

RSS Site Feed

AddThis Feed Button

JavaScript

The tools on this site are built using JavaScript. If you would like to learn more, one of the best free resources on the web is available at W3Schools.com.

Other Cool Resources

ZunZun - Exceptional regression analysis tool.
Wolfram Integrator - Solve integrals. Do calculus!
Create a Graph - Easy-to-use basic graph-making tool.
Many Eyes - Data visualization extraordinaire!


Archives
December 2004
January 2005
February 2005
March 2005
April 2005
May 2005
June 2005
July 2005
August 2005
September 2005
October 2005
November 2005
December 2005
January 2006
February 2006
March 2006
April 2006
May 2006
June 2006
July 2006
August 2006
September 2006
October 2006
November 2006
December 2006
January 2007
February 2007
March 2007
April 2007
May 2007
June 2007
July 2007
August 2007
September 2007
October 2007
November 2007
December 2007
January 2008
February 2008
March 2008
April 2008
May 2008
June 2008
July 2008
August 2008
September 2008
October 2008
November 2008
December 2008
January 2009
February 2009
March 2009
April 2009
May 2009
June 2009
July 2009
August 2009
September 2009
October 2009
November 2009
December 2009
January 2010

Pajamas Media BlogRoll Member
Big Picture, The
Bloodhoundblog
Budgets Are Sexy
Cafe Hayek
Carpe Diem
Cheap, Healthy, Good
College Analysts
Copywriting Tips
Core77
Coyote Blog
Craig Harper
Darwin's Finance
Digerati Life, The
Disciplined Approach to Investing
Dividend Guy, The
Division of Labour
Doug Short
Dough Roller, The
Eclectecon
Econlog
Economics Roundtable
EconomicsUK
Entrepreneurial Mind
Environmental Economics
Escape from Cubicle Nation
Execupundit
Fat Pitch Financials
Fiscal Geek
Fortify Your Oasis
Get Rich Slowly
Gongol
Good Financial Cents
HR Bartender
Hot Air
i4cp Productivity
Ideologic LLC
Instapundit
Intangible Economy
I've Paid Twice for This Already
Joanne Jacobs
Kaus Files
Little Green Footballs
Mahalanobis
Making Ripples
Market Power
Mechonomics
Mighty Bargain Hunter
Monevator
Money Blue Book
My Dollar Plan
New Economist
Newmark's Door
Nina Simosko
Physorg
Private Sector Development
Radio Equalizer
Real Clear Politics
Richard Fernandez
Roger L. Simon
SCSU Scholars
Skeptical Optimist
Sound Politics
SOX First
Speculist, The
Sports Economist, The
squawkfox
The Truth Laid Bear
Three Star Leadership
Tim Worstall
Tough Money Love
Townhall
Trusted Advisor
voluntaryXchange
WILLisms
Winterspeak

Seeking Alpha Certified