One of the deans of econblogging, Kash Mansoori, pointed to our most popular post yesterday in reporting that:
If you plug today's interest rates into that calculator, it tells us that there's a 52% chance that we'll have a recession sometime in the next 12 months. That's a pretty high chance.
We have a minor quibble with Kash's calculation, as it appears he used the yield data for the 5-year Treasury instead of the 10-year Treasury yield that the model upon which the tool is based requires. We dropped Kash the following note, in which we cited the most current recession odds data (as of mid-day yesterday):
I think you might be mixing up the 5-year and 10-year treasury rates in using the recession odds reckoning tool over at my blog in calculating your recession probability of 52%. Wright's model specs out the 10-year and 3-month Treasury yields for finding the probability of recession.
Using the 5.31% effective Federal Funds Rate for 10/31, along with the current 3-month intraday yield of 4.92% and the 10-year intraday yield of 4.56% (both as of this typing) gives the probability of a recession starting in the next 12 months of 48.5%. Don't get me wrong - it's the highest the probability has been since the Fed began it's most-recent tightening cycle, but it still hasn't crossed the key 50% threshhold as yet.
For the best comparison to Wright's results, you'll need to use the yield and effective FFR data as of market close. There can be a lot of movement in the intraday that doesn't necessarily show up in the officially recorded closing bell numbers.
As it happens the closing bell numbers for November 1: the effective Federal Funds Rate was 5.23%, the 3-Month Treasury was 4.92% and the 10-Year Treasury was 4.56%. All these values combine to produce a probability of recession beginning in the next 12 months of 47.3% as of November 1.
How to Make the Recession Call
As this number is uncomfortably close to the key 50% probability threshhold, it does raise an interesting question: What will it take to switch from being on the fence (by definition, a 50% probability) to making the call that there will indeed be a recession?
To answer this question, we tapped the Federal Reserve's historical records for each of the components that goes into the recession probability calculation. We loaded up our spreadsheet software with the available data, ran the numbers, and found a recurring pattern as the U.S. economy approached the 50% probability mark.
We'll spare you the spreadsheet, but the pattern is essentially this:
- The probability of recession in the next four quarters bounces around the 50% mark for a short period of time, typically for one to two weeks.
- Then, the probability of recession grows significantly past the 50% mark in a relatively short period of time.
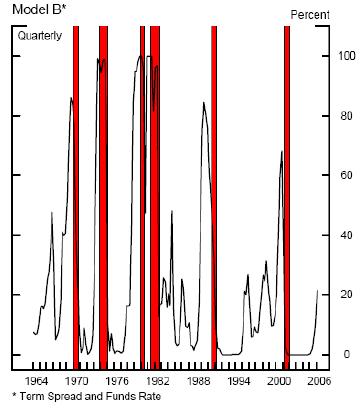
That latter point is illustrated by this chart from Jonathan Wright's original paper:

The chart above shows two periods where the odds of recession spiked up near the 50% level, then receded with no following recession, in both 1966 and 1983. Meanwhile, when a recession does follow crossing the key 50% threshhold, the probability of recession grows significantly past this point.
So, recession hounds, if you're looking to predict a recession, that's what you need to see to confidently make the call!
Welcome to the blogosphere's toolchest! Here, unlike other blogs dedicated to analyzing current events, we create easy-to-use, simple tools to do the math related to them so you can get in on the action too! If you would like to learn more about these tools, or if you would like to contribute ideas to develop for this blog, please e-mail us at:
ironman at politicalcalculations
Thanks in advance!
Closing values for previous trading day.
This site is primarily powered by:
CSS Validation
RSS Site Feed
JavaScript
The tools on this site are built using JavaScript. If you would like to learn more, one of the best free resources on the web is available at W3Schools.com.