Now that we've refined our analysis of the major trends in U.S. layoff activity since January 2006, how can we further refine our analysis to predict what the number of seasonally-adjusted initial unemployment insurance claims will be in future weeks?
After all, our previous analysis suggested that the number of new unemployment claims for the week ending 23 April 2011, which the BLS will be releasing today, will most likely be somewhere between a low value of 360,540 and a high value of 409,963. With a difference of 49,423 between these two figures, which is the range defined by the current trend's plus-and-minus one standard deviation boundaries from the mean trend line, that's a really big gap into which the actual figure might likely fall. That's also assuming the current trend continues, which is itself a whole different matter.
So how can we narrow the gap and make a more precise forecast?
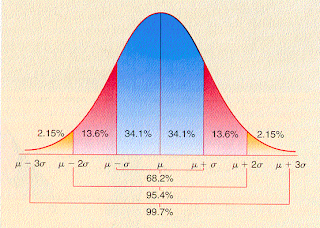
It occurred to us that we could apply residual analysis, which considers the difference between the actual data and the mean trend line. Here, if we correctly constructed our primary model describing the major trends, the remaining differences between the actual data and the mean trend line should be able to be described with a simple normal bell-curve type distribution.
The advantage here is that when we're working with rising or falling mean trends over time, the standard deviation of the residuals should be lower than the standard deviation of the trend data, because we've eliminated the effect of the changing value of the mean trend over time. That then allows us to narrow the likely range in which we can expect future data points to fall.
We've illustrated the results of our residual analysis in the chart below. We'll note that the standard deviation of the original data for the current trend is 24,711, while the standard deviation of the residual data for the current trend is 13,851, and the overall effect is to narrow the boundaries within which we expect the data within the trend to fall. This same dynamic applies to the other rising or falling linear trends shown on our chart, which you can compare to our previous analysis.

For the week ending 23 April 2011, the table below gives the following likelihoods of being within the given values:
| Forecast New Unemployment Claims for Week Ending 23 April 2011 | ||
|---|---|---|
| Probability of Being in Range | Range | Span |
| 68.2% | 371,370 - 398,833 | 27,164 |
| 95.4% | 358,088 - 412,415 | 54,327 |
| 99.7% | 344,506 - 425,997 | 81,491 |
Using the similar one-standard-deviation boundaries that we used in our previous analysis, we would anticipate that there is a 68.2% probability that the number of new unemployment claim filings for the week of 23 April 2011 will fall between 348,964 and 376,126. That possible range is just over half as large as our original forecast range of 360,540 to 409,963.
Now, all we have to do is wait to see where the actual number falls!
Update: The advance data for the week ending 23 April 2011 has been released - the seasonally-adjusted number of initial unemployment insurance claim filings was 429,000. If this data is not an outlier, it marks the potential beginning of a new trend as the probability that a value falling above 425,997 in this week was just 0.15% for our residual analysis.
If sustained, we would not consider such a new trend to be a positive development, as it would mark the end of a period of improvement in U.S. layoff activity.
However, because this week's advance value is less than 436,680, which marks the uppermost band of probable values for our primary trend analysis, we cannot yet exclude the possibility that the current falling trend is continuing, although with greater volatility than we've seen prior to this point in time. We'll know within the next several weeks which situation applies.
Labels: jobs
Welcome to the blogosphere's toolchest! Here, unlike other blogs dedicated to analyzing current events, we create easy-to-use, simple tools to do the math related to them so you can get in on the action too! If you would like to learn more about these tools, or if you would like to contribute ideas to develop for this blog, please e-mail us at:
ironman at politicalcalculations
Thanks in advance!
Closing values for previous trading day.
This site is primarily powered by:
CSS Validation
RSS Site Feed
JavaScript
The tools on this site are built using JavaScript. If you would like to learn more, one of the best free resources on the web is available at W3Schools.com.