Have you ever wanted to know where the average price of a gallon of gasoline in the United States was headed next?
If so, our latest tool was designed with you in mind! Building on James Hamilton's regression analysis of oil prices and U.S. gasoline prices from 2000 through the present, the main thing you need to know to predict where the price of gasoline in the U.S. is the price of a barrel of Brent crude oil, which if you're accessing our site directly, appears in the upper right corner of this post (via Oil-Price.Net)!
All you need to do is enter that current price in our tool, and we'll estimate how much the average price of a gallon of gasoline will be in the U.S. within the next several weeks.
Hamilton explains the main factors behind the math:
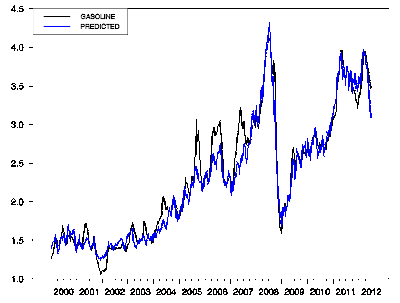
The price of gasoline and price of Brent turn out to be cointegrated, meaning that any permanent change in the price of Brent eventually shows up as a permanent change in the price of gasoline. The coefficients of the above relation are very much what you'd expect. A barrel holds 42 gallons, and the estimated coefficient (0.025) is 1/40. The intercept (0.84) captures an average state and federal tax of 50 cents per gallon plus a bit over 30 cents in markups and other costs.
With Brent on Friday at $91.50 and an average retail gasoline price about $3.47, we'd thus expect gasoline prices to come down another 35 cents a gallon or so from where they were on Friday. Historically those adjustments usually come pretty quickly. For example, last December U.S. gasoline prices temporarily fell about 25 cents/gallon below the long-run relation, but by March they were right back on track.
The default data for our tool is taken from Hamilton's Friday, 22 June 2012 data point described above. If you know the difference between the excise taxes per gallon of gasoline that apply in your state (visualized here) and the national average listed above, you can adjust our tool's results accordingly for your area.
One other factor to consider is the volatility in the price of Brent crude oil. Here, frequent fluctuations in the market price for a barrel of Brent crude oil means that it will be difficult to pin down a specific price for a gallon of gas in the U.S. at a specific point in the future.
But in general, our tool should put you very close to being in the right ballpark for where the price of gasoline is going in the U.S., and if Hamilton's chart is any indication, that's a pretty impressive achievement in itself.
Labels: forecasting, gas consumption, tool
Welcome to the blogosphere's toolchest! Here, unlike other blogs dedicated to analyzing current events, we create easy-to-use, simple tools to do the math related to them so you can get in on the action too! If you would like to learn more about these tools, or if you would like to contribute ideas to develop for this blog, please e-mail us at:
ironman at politicalcalculations
Thanks in advance!
Closing values for previous trading day.
This site is primarily powered by:
CSS Validation
RSS Site Feed
JavaScript
The tools on this site are built using JavaScript. If you would like to learn more, one of the best free resources on the web is available at W3Schools.com.
