
When the price of fuel soars, drivers who seek to avoid spending money on petroleum have two options. They can:
- Drive less, or
- Slow down.
For many, driving less is an obvious solution, but one that isn't necessarily achievable. That's comes down to why people have cars in the first place. They need them to travel to and from work and also to and from where they buy the goods and services they need.
In today's world, whether they drive a gas-powered, battery-powered or hybrid vehicle, some non-zero percentage of the fuel or energy needed to enable their ride will be produced by fossil fuels. When the price of oil and other fossil fuels rise, the cost of essential commuting goes up as well. But you can limit your exposure to those higher costs by slowing down to drive your vehicle at speeds where it is more efficient.
That fact was established by a nearly three-decade old study by the U.S. Department of Energy that found that most gasoline-powered vehicles in the U.S. are operated at speeds at which they do achieve their peak level of fuel efficiency. At highway speeds, for instance, the forces of aerodynamic drag can substantially increase the amount of fuel an automobile engine has to burn in order to sustain a high velocity. A simple back-of-the-envelope calculation reveals that the amount of drag force that a car being driven at 75 miles per hour sees is some 33% higher than the same car being driven at 65 miles per hour would see.
Though today's roads have more electric and hybrid vehicles driving upon them, they are still affected by the same laws of aerodynamics. Like gas-powered vehicles, it takes less energy to sustain them moving at lower speeds, which means their batteries can hold their charges for longer.
But not too slow. Driving too slow also comes not just with a time penalty but also an increased penalty for fuel consumption. Most modern vehicles are designed to operate most efficiently at speeds ranging from 30 to 55 miles per hour. That's the sweet spot in which you can get the most distance driving out for your fuel consumption dollar.
We've tapped that old study to reverse-engineer the Fuel Economy vs Speed average vehicle profile developed by the U.S. Department of Energy and create the following tool, in which you can find out who much money you might save by going slower. If you're accessing this tool on a site that republishes our RSS news feed, please click through to our site to access a working version of the tool.
The cool thing about this tool is that you now have more weapons in your arsenal to help fend off the effects of higher gasoline prices! Armed with this information, you can now make whatever trade-offs you might need to your greatest advantage. For example, if getting the greatest possible savings is most important to you, you'll want to drive at speeds that produce the lowest equivalent cost per gallon of gas compared to your normal driving speeds. If you want to save gas money and time, you'll want to drive at speeds that give you the greatest equivalent "tax free" income compared to how you drive today.
Image credit: Lighted Automotive RPM, Temperature, Fuel, and Speedometer Gauges photo by Kevin kevin on Unsplash.
Labels: gas consumption, gas prices, personal finance, tool


Imagine you're shopping for a new vehicle, or maybe more accurately, a newer vehicle than the one you have today. With gasoline prices running high, one of the things you're shopping for in that newer vehicle is better fuel economy.
Let's say the car you have today is a real gas guzzler. It only gets 10 miles per gallon. Shopping around, you find a newer car in your price range that gets 15 miles per gallon. That may not be great, but it is certainly more fuel efficient than your current vehicle.
Now, suppose one of your neighbors is also out shopping for a newer vehicle to replace theirs. The vehicle they have gets 25 miles per gallon and they've determined they can afford to buy a vehicle that gets double that mileage.
If you and your neighbor drive the same distance every year, which one of you will save more gas after switching to drive your respective more fuel-efficient vehicles?
You can find out with the following tool, where you only need to enter the fuel efficiency numbers for your vehicles of interest and annual miles driven. If you're reading this article on a site that republishes our RSS news feed, click here to access a working version of this tool.
We've set the default data in the tool up to run the numbers for your hypothetical neighbor's newer vehicle. It finds they will reduce the amount of fuel they use in driving 15,000 miles per year by 300 gallons.
We'll let you update the numbers in the tool yourself to run the scenario for how much you might save for your own newer, more fuel-efficient vehicle, but if you run the suggested scenario of exchanging a 10 miles per gallon vehicle for one that gets 15 miles per gallon, you'll find you'll save 500 gallons. That's 200 more gallons per year than what your neighbor who bought a vehicle with double the fuel efficiency would save.
What if you bought the vehicle that can go 50 miles per gallon? Well, you could completely smoke your neighbor by saving 1200 gallons per year. But the question you need to answer is whether you can afford to buy that vehicle. Assuming that less fuel-efficient vehicles are more affordable than more fuel-efficient models, it's quite possible you could spend a lot less and still save more gas per year than your neighbor.
The examples for this tool came from this Vox article, which advocates for a better way for the automotive industry to communicate how fuel efficient the vehicles they sell are, but which ignores the personal finance issues of affordability and flunks the economics. The article is inspired by a 2008 paper that argues the Mile Per Gallon ratings for vehicles provide a misleading picture of their relative fuel efficiency. We figured it was easier to understand that argument by providing a tool to do the fuel savings math.
Image credit: Fuel Meter, Meter, Indication vector graphic by Clker-Free-Vector-Images from Pixabay.
Labels: gas consumption, personal finance, tool
Earlier this summer, Senator Debbie Stabenow (D-Michigan) made news as she bragged high gasoline prices don't matter to her because she drives an electric car, a Chevrolet Bolt EUV, which allows her to drive past gas stations without having to pay for petrol. Here's video of her statement:
While high gasoline prices may not matter to the senator, they may matter to you if you're considering following her example and buying an electric-powered vehicle. Do they provide a bigger bang for the buck for their owners than a petroleum-fueled vehicle?
To find out, we need to compare gasoline and electric powered vehicles that are as similar as possible to one another. Unfortunately, we cannot do that with the Chevy Bolt because there isn't a gasoline-powered version of that vehicle. But we can do that with a Mini Cooper Hardback 2-Door, which comes in gasoline-fueled and electric-powered versions.
We've entered the data for both these vehicles as the default entries in the following tool. If you're accessing this article on a site that republishes our RSS newsfeed, please click through to our site to access a working version to find out how different their costs of ownership, or the vehicles whose data you might enter instead, may be over three years.
Most of the default data in the tool comes from a Car and Driver article from 2020, which we've updated with early September 2022's average gasoline cost and electricity cost data, both of which you can update as needed with more current gasoline and electricity costs that apply in your region.
The vehicle cost data comes from Edmunds, which we extracted during 2022's Labor Day Holiday weekend. We should note that the electric version of the Mini Cooper Hardtop 2-Door appears to have increased by $4,115 since the federal EV tax credit of $7,500 was enacted as part of the Inflation Reduction Act. The manufacturer's suggested retail price of the gasoline fueled version of the vehicle was unchanged. Other manufacturers have similarly hiked their electric vehicle prices in the weeks since the government subsidy for electric vehicles was passed.
For the default data loaded in the tool, we find the gasoline powered version of the Mini Cooper Hardtop 2-Door is the better buy. Playing with the tool, we found an average gasoline price of $6.37 per gallon with the electricity cost unchanged would be needed to make the electric vehicle a less costly choice over three years of ownership. But, as they say, your mileage may differ - take the tool for your own test drive!
Labels: environment, gas consumption, personal finance, tool
In the United States, the days before and after the annual Thanksgiving holiday represent busiest days for travel in the U.S. each year. If you care about the environment, what do you suppose is the mode of travel that will consume the least amount of energy on average and will have the smallest carbon footprint for how far you might travel to be with your friends and family this year?
The answer may surprise you! We've visualized data showing the trends for the average energy intensity, or rather, the average energy consumed per passenger mile, for several different modes of passenger transportation in the U.S. from 1975 through 2016 in the interactive chart below. If you're accessing this article on a site that republishes our RSS news feed, please click through to our site to access it there.
In the chart, "Light Truck" refers to any two-axle, four wheel truck, which would include anything from pickup trucks to SUVs. "Air" refers to commercial air travel, while "Intercity Rail" in the U.S. means train travel via Amtrak.
Probably the most remarkable thing is how air travel has become less energy intensive per passenger mile than both transit buses (after 1996) and cars (after 2004). The second most remarkable thing we find is how transit buses have become worse over time.
We should note however that the values in the chart represent the average for each mode of passenger transportation. Individual vehicles within each mode have a wide amount of energy intensity variation, where your carbon footprint for travel will depend on it. For example, there's a big difference in fuel efficiency between jets that began flying 25 years ago and are still in service and newer versions that have rolled off their assembly lines more recently. The same is true for all the other modes of transportation.
Environmentally speaking, the average BTUs per passenger mile for each mode is directly proportional to the amount of carbon emissions it produces, where each 1 million BTUs consumed produces the equivalent of 53 kilograms of emitted carbon dioxide. If you're traveling, the greenest thing you can do is choose the least energy intensive mode of transportation that can get you to where you need to be within the time you have available to travel.
If you're traveling to your Thanksgiving destination today, you have our sympathy!
References
Davis, Stacy C. and Boundy, Robert G. Transportation Energy Data Book. Edition 37.2. Table 2.14: Energy Intensities of Highway Passenger Modes, 1970–2016. Table 2.15: Energy Intensities of Nonhighway Passenger Modes, 1970-2016. Oak Ridge National Laboratory. [PDF Document]. August 2019.

Labels: data visualization, environment, gas consumption, thanksgiving, travel
For months now, the cost of a barrel of crude oil has been falling and now, those prices are falling rapidly.
But what does the falling price of crude oil today mean for you at the gasoline pump? How will the price of a barrel of crude oil translate into the price you pay per gallon?
Well, we have an app for that! It's based on James Hamilton's regression analysis of oil prices and U.S. gasoline prices from 2000 through the present, the main thing you need to know to predict where the price of gasoline in the U.S. is the price of a barrel of Brent crude oil, which if you're accessing our site directly, appears below (via Oil-Price.Net)!
All you need to do is enter that current price in our tool, and we'll estimate how much the average price of a gallon of gasoline will be in the U.S. within the next several weeks.
This tool is an updated version of our original Where Are U.S. Gas Prices Going? tool, the math for which has become very relevant again!

Labels: economics, gas consumption, tool
Good morning, White House Staffer!
Say, do you remember when we said you should enjoy it while you can as the average price of gasoline in the U.S. dropped below $3.50 per gallon back in June?
Summer's over dude, and has been for well over a month!
Although your boss' spokesman is chillin' from his job (such strange behavior with the national election less than six weeks away, but what should we expect when the boss himself has been phoning it in all this time!), maybe you should have spent more time working on real, non-election-related stuff for the last four months, because gas prices in the U.S. have spiked sharply upward. Again.
So, to help you better understand why you really don't want that to happen, we've updated our tool that allows you to roughly forecast what today's high gas prices will mean for tomorrow's soon-to-come unemployment rate in the U.S. Basically, we've incorporated all the available data through September 2012 and accounted for inflation through that month as well.
| |||
Just for fun, you should try this exercise using yesterday's average price of gasoline in California, $4.67.
"Good Morning, White House Staffer" is a special feature we run periodically whenever the average U.S. national retail price for gasoline rises above $3.50 per gallon!
Labels: forecasting, gas consumption, tool, unemployment
How much of an effect do high gasoline prices have upon the rate of layoffs in the U.S. economy?
Today, following the initial confirmation of our hypothesis that they do have a significant effect as measured by the number of new jobless claims filed every week, we're going to attempt to quantify how big an impact that high gasoline prices has upon the employee retention decisions of U.S. employers.
We define "high gasoline prices" as being when the national average price of a gallon of regular unleaded gasoline in the United States rises above $3.50 per gallon, in terms of 2011-12 U.S. dollars. This price level appears to be significant in affecting both the spending of U.S. consumers, who respond by cutting back their spending on other goods and services, and the cost of doing business for U.S. employers, who face higher fuel and transportation costs, both directly and indirectly through their supply chains.
Previously, we've observed that whenever the national average price of gasoline crosses this level, the number of seasonally-adjusted initial unemployment insurance claims that are filed each week is affected some two to three weeks later. If it rises above the $3.50 per gallon mark, we observe an upward shift in the number of new jobless claims being filed and if it falls below it, we observe a downward shift in the number of new jobless claims being filed each week.
An upward shift corresponds to the situation where business revenues are falling while costs are rising, triggering the decision to lay off employees, while a downward shift corresponds to the opposite situation, resulting in employees being retained.
The two-to-three week long time lag between when the price of gasoline crosses this critical level to when it shows up in the BLS' new jobless claims data may be attributed to the typical payroll cycle of U.S. businesses, where they react to the change in their business outlook with their next payroll cycle - allowing the current payroll cycle to play out. Since the vast majority of Americans are paid weekly, biweekly or semi-monthly, the time-delayed reaction of employers to an event affecting their employee retention decisions to when in shows up in the government's official data is about 2 to 3 weeks.
We have previously attributed the last four shifts in the major trends for new jobless claims in the U.S. to the national average gasoline price crossing the apparently critical threshold of $3.50 per gallon. And because it just rose above that level on the week ending 30 July 2012 after having fallen below it just several weeks before that, we anticipate we'll see a significant upward shift with either this week's jobless claim data or with next week's data.
That's the "coming surge" we described in the title of this post. But how big will that surge be?

Looking over the past four shifts in the major trends for new jobless claims, we would anticipate that having average gasoline prices in the U.S. rise above $3.50 per gallon will add anywhere from an additional 15,000 to 25,000 to the number of people filing for first-time unemployment insurance benefits each week while gasoline prices remain high.
That brings us to our next problem: volatility in the data.
Previously, we had the benefit of gasoline prices remaining steadily either above or below the $3.50 per gallon mark for extended periods of time, which makes it relatively easy to measure the size of the shift in new jobless claims.
But with gasoline prices hovering so close to the apparently critical threshold of $3.50 per gallon right now, we can expect to see quite a bit of volatility in the weekly data for new jobless claims, as the shifts we describe are combined with natural statistical variation about the underlying trend for new jobless claims, which has been rising since mid-February. And especially if the average price of gas in the U.S. keeps crossing the threshold!
As a result, we could very well see some pretty dramatic swings from week to week until gasoline prices stabilize either above $3.50 per gallon or below it.
Labels: gas consumption, jobs
Do high gasoline prices affect the number of layoffs in the United States?
We're going to put our empirical observation-backed hypothesis that "Yes. Yes They Do" to the test during the next several weeks to see if we can get a solid answer to that question!
Here, we're defining "high gasoline prices" as being when the average price of a gallon of regular (unleaded) gasoline in the U.S. exceeds $3.50 per gallon in terms of 2011-12 U.S. dollars, as reported by the U.S. Energy Information Agency. We're also measuring the number of layoffs in the U.S. by the number of seasonally-adjusted initial unemployment insurance claims that are filed each week, as reported by the U.S. Department of Labor.
The test we're about to run hinges on an event that occurred in the week between 18 June 2012 and 25 June 2012, when the average price of gasoline in the United States fell back below the $3.50 per gallon mark.
Here, if our hypothesis holds, we'll see a shift in the trend for new jobless claims being filed some two to three weeks later, as employers react to this positive development which reduces their cost of doing business and also increases the disposable income of U.S. consumers after their current pay cycle ends and their next pay cycle begins.
Since most people in the U.S. are paid on a weekly, biweekly, or semi-monthly basis, that means a two to three week delay between when an event affecting employee retention decisions takes place to when it actually shows up in the weekly data for new jobless claims in the U.S.
After that, it can take several weeks longer to confirm the change in trend. Speaking of which, our chart below shows the previous two trends, along with the current trend:

We could see a shift begin as early as this week or next, however we expect it will be several weeks beyond that before we could confirm such a shift in the trend, given the effect the Fourth of July holiday will likely have on data reporting and the BLS' continuing issues with upward revisions to their initially-reported data in subsequent weeks.
Labels: gas consumption, jobs
Have you ever wanted to know where the average price of a gallon of gasoline in the United States was headed next?
If so, our latest tool was designed with you in mind! Building on James Hamilton's regression analysis of oil prices and U.S. gasoline prices from 2000 through the present, the main thing you need to know to predict where the price of gasoline in the U.S. is the price of a barrel of Brent crude oil, which if you're accessing our site directly, appears in the upper right corner of this post (via Oil-Price.Net)!
All you need to do is enter that current price in our tool, and we'll estimate how much the average price of a gallon of gasoline will be in the U.S. within the next several weeks.
Hamilton explains the main factors behind the math:
The price of gasoline and price of Brent turn out to be cointegrated, meaning that any permanent change in the price of Brent eventually shows up as a permanent change in the price of gasoline. The coefficients of the above relation are very much what you'd expect. A barrel holds 42 gallons, and the estimated coefficient (0.025) is 1/40. The intercept (0.84) captures an average state and federal tax of 50 cents per gallon plus a bit over 30 cents in markups and other costs.
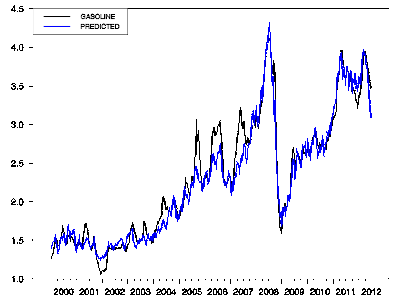
With Brent on Friday at $91.50 and an average retail gasoline price about $3.47, we'd thus expect gasoline prices to come down another 35 cents a gallon or so from where they were on Friday. Historically those adjustments usually come pretty quickly. For example, last December U.S. gasoline prices temporarily fell about 25 cents/gallon below the long-run relation, but by March they were right back on track.

The default data for our tool is taken from Hamilton's Friday, 22 June 2012 data point described above. If you know the difference between the excise taxes per gallon of gasoline that apply in your state (visualized here) and the national average listed above, you can adjust our tool's results accordingly for your area.
One other factor to consider is the volatility in the price of Brent crude oil. Here, frequent fluctuations in the market price for a barrel of Brent crude oil means that it will be difficult to pin down a specific price for a gallon of gas in the U.S. at a specific point in the future.
But in general, our tool should put you very close to being in the right ballpark for where the price of gasoline is going in the U.S., and if Hamilton's chart is any indication, that's a pretty impressive achievement in itself.
Labels: forecasting, gas consumption, tool
With the national average price of gasoline in the U.S. officially set to fall below $3.50 per gallon during this week, we have discontinued running our "Good Morning, White House Staffer" feature at the top of our site, as we promised last week - we've attached it for reference to the end of this post.
With that improvement in the average gasoline price, we anticipate that the reported pace of layoffs in the United States will change somewhat for the better within the next two to three weeks, as employers adjust their employee retention plans during their next pay cycle. Here, the employer reaction will be driving by the combination of their lower cost of doing business and an effective increase in the discretionary disposable income of Americans, who will increasingly have more money to spend on things other than gasoline.
We have previously observed that the $3.50 per gallon mark in the national average price of gasoline, as measured in terms of 2012 U.S. dollars, seems to be the magic threshold at which new jobless benefit claim filings reported by the U.S. Department of Labor are affected by gasoline prices.
In practical terms, we should see the trend in the number of new jobless claims shift to a less negative trajectory, as gasoline prices will have fallen to a level where they will stop having a direct impact upon the rate at which Americans file for first-time unemployment insurance benefits.
We say "less negative" instead of "positive" because other factors will dominate the overall trend. Namely, the failing economies in both Europe and Asia, where the falling relative demand for oil expected in the future is the principal reason why global oil and gasoline prices are now falling. We anticipate that the economic situation in these nations will increasingly and negatively affect the U.S. economy into 2013.
In the short term however, we anticipate that the U.S. economy will see a bit of improvement from the current quarter, which we've previously described as effectively being in a microrecession.
Enjoy it while you can!
|
"Good Morning, White House Staffer" is a special feature we run whenever the average U.S. national retail price for gasoline rises above $3.50 per gallon!
Labels: forecasting, gas consumption, jobs, tool
 Good morning, White House Staffer!
We appreciate your daily visits, as you continue your ongoing efforts to closely monitor the U.S. gasoline price situation. We have, after all, tailored our top-of-the-page "Good Morning, White House Staffer" feature specifically to assist you in your daily task.
But we're afraid that we'll soon be taking down our feature, as the average retail price of a gallon of unleaded gasoline in the United States has fallen below $3.55 per gallon. Given the potential for volatility in that average price, we'll keep it going until it firmly drops below $3.50 per gallon, as this will help ensure that we don't discontinue our feature too early, should there be any unexpected supply disruptions in the next several weeks that might boost it back over the $3.55 per gallon mark.
That's good news for you, in the short term sense, as we expect that U.S. employers will react positively to falling fuel and transportation prices, which if our previous observations hold, will mean that the pace of weekly layoffs in the United States will change for the better within 2-3 weeks of the national average gasoline price dropping below $3.50 per gallon, which we would measure by the number of seasonally-adjusted new unemployment insurance benefit claims filed each week.
As we remarked on 31 May 2012:
If we're lucky in the short term, we'll see if the rate of layoffs that prompt new unemployment insurance claim filings shifts to a new, more positive trajectory if gasoline prices fall back below the $3.50 per gallon mark in the weeks ahead.
But then, we'll be unlucky in the longer term because that will mean that the world demand for oil will have dropped enough to make that possible, as much of the world appears headed for recession. That of course will have consequences for the U.S. economy.
In the meantime though, we continue to expect the U.S. economy will rebound a bit in the third and fourth quarters of 2012, after passing through the equivalent of a microrecession during the current second quarter. The story for 2013 will be very different, we're afraid....
That said, our previous advice to you to keep your résumé up to date still holds. We would also suggest that this summer will perhaps present the best opportunity you will have to sell your metropolitan Washington D.C. home before that real estate market changes.
And now you can't say that you weren't warned when it mattered most - when you still had time to do something about your situation!
Previously on Political Calculations
- New Jobless Claims: Thunderdome Edition!
- Visualizing the Actual Price of Gasoline Across the U.S.
- Gasoline Prices and the Unemployment Rate
- How High Gas Prices Affect the Number of Layoffs
- Questions from Our Inbox: Why Are Gasoline Prices Rising So Much?
- Scheduling the Next U.S. Recession
- How Much Might Producing More (or Less) Oil Change Its Price?
- Surprising Impotence
- Who's Behind the Drop in Gas Prices?
- Changing the Outlook for Oil Prices
- Holy Gas Prices Batman! It's the New Batmobile!...
- Using Gas Prices to Forecast the Unemployment Trend
- Correlating the Price of Gas and the Unemployment Rate
- Why Are Americans Driving Less?
- How Much Does Your Commute Cost You?
- Should You Move Closer to Work to Save Commuting Costs?
- How to Save Money on Gas, Without Driving Less
- How Much Are Higher Gas Prices Really Hurting You?
- Should You Trade in Your Gas Guzzler?
- Is It Worth the Drive?
- Do Hybrids Really Save Money?
- How Much Do You Pay in Gas Taxes?
Labels: gas consumption
It seems that unlike say a "trained journalist" like the Incredibly Incurious Jonathan Chait, our casual readers are more than capable of asking us questions about our work!
Proof of that today comes straight from our e-mail inbox, which we can attest has still not registered any electronic contact initiated by "trained journalist" Chait, where someone with actual curiosity observed and asked:
Gas prices are about as high as they were in mid 2008 when oil was about 140 per barrel but oil today is about 110. Why the disconnect?
That's a good question - one for which we had no idea what might be the answer before we decided to take it on! Here's our augmented response, where we've expanded upon our original reply to our inquiring reader!...
It's not as disconnected as you might think, given which crude oil and gasoline prices are primarily involved.
Here, the increasing price of Brent crude oil that we've previously discussed...:

Source: livecharts.co.uk - 26 February 2012
... is being pushed upward by geopolitical concerns. That upward price pressure has combined with already falling demand in the U.S....:

... to force the closure of money-losing refineries in the U.S. that refine Brent crude oil, mainly on the East coast.
Matthew Philips of Bloomberg BusinessWeek provides more details from a 23 February 2012 article:
The average price of gas is up more than 10 percent since the start of the year, a point repeatedly made during Wednesday's Republican Presidential debate. Predictably, the four GOP candidates blamed President Barack Obama for the steep increase.
Actually, the President doesn't have that kind of pricing power. The more likely reason behind the price increase, though certainly less compelling as a political argument, is the recent spate of refinery closures in the U.S. Over the past year, refineries have faced a classic margin squeeze. Prices for Brent crude have gone up, but demand for gasoline in the U.S. is at a 15-year low. That means refineries haven't been able to pass on the higher prices to their customers.
As a result, companies have chosen to shut down a handful of large refineries rather than continue to lose money on them. Since December, the U.S. has lost about 4 percent of its refining capacity, says Fadel Gheit, a senior oil and gas analyst for Oppenheimer. That month, two large refineries outside Philadelphia shut down: Sunoco's plant in Marcus Hook, Pa., and a ConocoPhillips plant in nearby Trainer, Pa. Together they accounted for about 20 percent of all gasoline produced in the Northeast.
This week, Hovensa finished shutting down its refinery in St. Croix. The plant processed 350,000 barrels of crude a day, and yet lost about $1.3 billion over the past three years, or roughly $1 million a day. The St. Croix plant got hit with a double whammy of pricing pressure. Not only did it face higher prices for Brent crude, but it also lacked access to cheap natural gas, a crucial raw material for refineries. Without the advantage of low natural gas prices, which are down 50 percent since June 2011, it's likely that more refineries would have had to shut down.
The U.S. refining industry is being split in two. On one hand are the older refineries, mostly on the East Coast, which are set up to handle only the higher quality Brent "sweet" crude–a benchmark of oil that comes from a blend of 15 oil fields in the North Sea. Brent is easier to refine, since it has a low sulfur content, though it's gotten considerably more expensive recently. (Certainly another reason for higher gas prices.)
[Be sure to read the whole article, because it also explains why gasoline prices are so much lower elsewhere in the U.S.]
The combination of rising gasoline prices with reduced quantities being supplied indicate that the relative decrease in supply stemming from the recent refinery closures is currently driving the price of gasoline in the U.S. by more than what would be driven by rising crude oil prices alone:
And that, in a nutshell, is why gasoline prices have risen as high as they did back in 2008, even though crude oil prices haven't risen as high as they did then.
We will note however that actual journalist Matthew Philips is incorrect when he suggests that "the President doesn't have that kind of pricing power". The supply disruptions from the closure of money-losing oil refineries on the East coast and their result effect upon gasoline prices could have been minimized simply by subsidizing their operations - much as the President has been willing to subsidize "green energy" companies that were also certain to fail, like Solyndra.
By our estimate, the $500 million of taxpayer money that the President put on the line and lost on that one company would have been sufficient to keep just one of these recently closed refineries going for another 500 days - thus avoiding the supply disruption and massive run-up in U.S. gasoline prices. (And that doesn't include all the other "green energy" business failures where taxpayer money has been permanently lost that could have gone to create or save real refinery jobs!)
At least then, taxpayers might have something more to show for the money the President was so determined to waste, no matter what!
Labels: economics, gas consumption
John Iacovelli recently ran some "back of the envelope" calculations on the potential impact of Western country sanctions on Iran upon world oil prices. He estimated:
The U.S. Energy Information Administration in its latest tables stated that the Persian Gulf states produced 23,714 thousand barrels per day of crude as of October 2011, which we'll round to 23.7 million.
At the current time, Saudi Arabia is already producing more than usual to make up for the drop in Libya oil production. Let us arbitrarily state, then, that the other Gulf states will make up no more than 20% of the shortfall in Iranian production; thus, the calculation would be as follows:
- 23.7 million, total Gulf production
- minus .8 million (loss of 1 million Iran, plus .2 additional additional from Saudi Arabia and/or others)
- equals 22.9 million as the new production level.
- .8 divided by 23.7 equals a percentage drop of 3 and 1/3 percent. (-0.033)
Taking our PED formula and the Wikipedia coefficient for world oil, then:
- -.4 times -.033 = +1.33 percent change in the price of Persian crude, based upon the drop in supply.
The January 2012 price of Dubai crude (the benchmark for the region) is $110. Adding 1 1/3% puts the new price at $113.63.
I'm neither a mathematician nor an expert in oil pricing, and so would love to hear from anyone who has experience in the subject regarding this exercise. I know enough to know that my calculations could be hysterically off the mark.
But are they hysterically off the mark? To find out, we'll adapt a tool we originally developed in November 2011 to estimate what the impact would be upon world oil prices if the United States increased its production of oil by 25%.
Here though, we'll use the CIA's current estimate for world oil production in 2010 of 89,346,535 barrels per day, the most recent year for which the data is available (even going by the Energy Information Administration's world data, which as of 12 January 2012, only covers 10 months of 2010.)
The CIA's data indicate that Iran, the fourth largest producer of oil in 2010, produced 4,252,000 barrels per day that year. If sanctions imposed by Western nations only affect 25% of Iran's production, then the effect would be to reduce the daily supply of oil to the world by 1,063,000 barrels per day.
Because most of the oil that would be affected by sanctions upon Iran would be shipped to Europe, we'll use the average January 2012 spot price of $110.69 per barrel for Brent crude oil in Europe as our price reference.
The results may be found by clicking the "Calculate" button below!
As always, you're more than welcome to update our tool with more recent data or to consider other assumptions or scenarios!
Using our tool, we would anticipate that the price of Brent crude oil in Europe would rise by $4.39 per barrel, from $110.69 in January 2012 to $115.08 as a result of Iranian oil being embargoed by Western nations, if not offset by increases in the oil production of other nations. Such as the United States, which is experiencing somewhat of a boom in new oil production.
If Iran's oil production were completely shut off from the world, and no other oil producers adjusted their supplies to compensate, the effect upon European oil prices would be to increase the cost of each barrel of Brent crude oil by by $17.39.
So all in all, we find that John Iacovelli's math appears to be largely on target, as the results are consistent with what we find using slightly different assumptions about the elasticity of oil supply and demand.
Labels: gas consumption, tool
Welcome to the blogosphere's toolchest! Here, unlike other blogs dedicated to analyzing current events, we create easy-to-use, simple tools to do the math related to them so you can get in on the action too! If you would like to learn more about these tools, or if you would like to contribute ideas to develop for this blog, please e-mail us at:
ironman at politicalcalculations
Thanks in advance!
Closing values for previous trading day.
This site is primarily powered by:

CSS Validation

RSS Site Feed

JavaScript
The tools on this site are built using JavaScript. If you would like to learn more, one of the best free resources on the web is available at W3Schools.com.
Other Cool Resources
Blog Roll


