How did the overall level of reported GDP change as a result of the BEA's finally including research and development (R&D) and also arts and entertainment (A&E) production as part of U.S. GDP?
Here, both R&D and A&E are now being accounted for by the BEA as fixed assets rather than as intermediate components of producing goods and services, which effectively boosts the reported level of GDP.
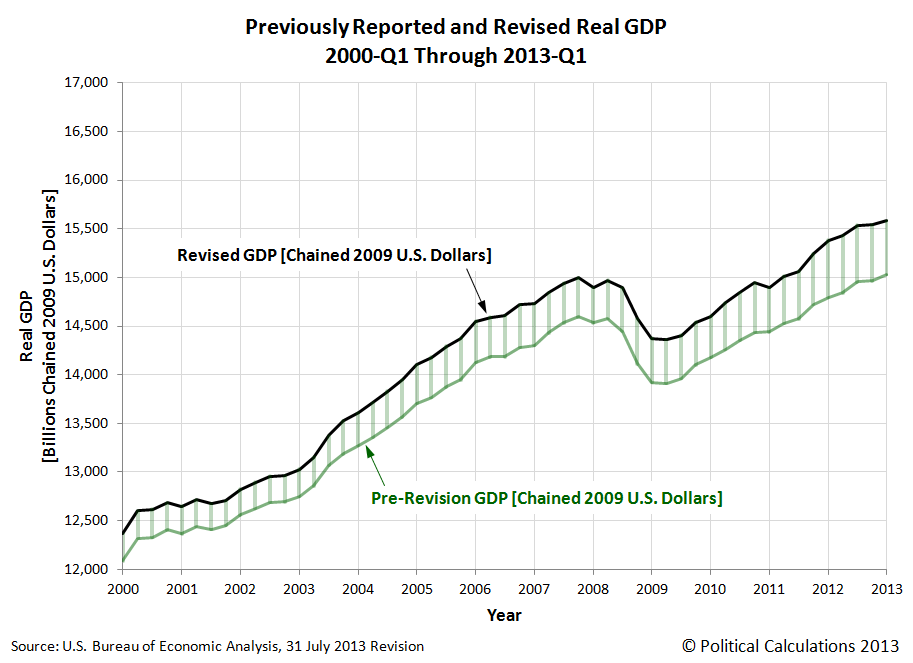
To find out, we first converted the pre-revision data from being in terms of inflation-adjusted, chained 2005 U.S. dollars to be in terms of inflation-adjusted, chained 2009 U.S. dollars, which we've presented as the green line in our chart below. We next charted the newly revised real GDP figures being reported by the BEA as the black line, then drew lines between the various quarterly data points to help visualize how much the data changed from the previous revision.
In this chart, which presents all of the BEA's quarterly data for GDP from the first quarter of 1947 through the first quarter of 2013, we find that R&D and A&E production had very little impact on GDP up until 1983, when it finally reached a share of 1% of real GDP. Ten years later, that share of GDP had doubled, and through the first quarter of 2013, has now reached a share of 3.5% of the real U.S. economy.
Our next chart focuses on the data since the first quarter of 2000.
The main news for this period is that with the revision, the 2007 recession was not as deep as previous data indicated, and the recovery was somewhat stronger.
But perhaps the most surprising revision in the data applies for the first quarter of 2011, when GDP appears to have contracted, as the data had previously indicated slightly positive growth. White House economist Alan Krueger blamed the economic shrinkage on the disruption to world supply chains stemming from the Japanese tsunami.
That particular event occurred on 11 March 2013, just 19 days before the end of the first quarter of 2011. In reality though, most of that effect wouldn't show up in the U.S. economy until the second quarter of 2011, since the transit times between the U.S. and Japan for cargo are such that any trade between the two that would be recorded in the economic statistics for the first quarter in 2011 would already have been en route at the time of the tsunami and would only need to be re-routed to non-damaged port facilities in Japan, an observation that is backed by trade data recorded for both March and April in 2011. Meanwhile, plants shut down in Japan as a result of the event would not affect production at U.S. facilities for several weeks following the event, and many U.S. facilities of affected Japanese companies, which would be the most likely to be impacted, continued production without any stoppages.
Since most of the adjustment related to the BEA's data revision affects GDP data since 1980, we thought it might be fun to present large-scale versions of our GDP temperature gauge charts. The first of these charts shows the one-quarter real annualized GDP growth rate for each quarter from 1980-Q1 through the first estimate of the GDP growth rate for 2013-Q2:
Our next chart presents the annualized two-quarter real GDP growth rate for each quarter from 1980-Q1 through 2013-Q2. Since this data is much less subject to volatility, we use it for forecasting, as it provides a more accurate picture of the pace of economic growth in the United States over time:
These charts provide an indication of how strong the U.S. economic growth rate is, which can range from a "hot" red (growing at a rate greater than 5.5%) to a recessionary "cold" purple (growing at a rate less than 1.5%).
Labels: gdp
Welcome to the blogosphere's toolchest! Here, unlike other blogs dedicated to analyzing current events, we create easy-to-use, simple tools to do the math related to them so you can get in on the action too! If you would like to learn more about these tools, or if you would like to contribute ideas to develop for this blog, please e-mail us at:
ironman at politicalcalculations
Thanks in advance!
Closing values for previous trading day.
This site is primarily powered by:
CSS Validation
RSS Site Feed
JavaScript
The tools on this site are built using JavaScript. If you would like to learn more, one of the best free resources on the web is available at W3Schools.com.


