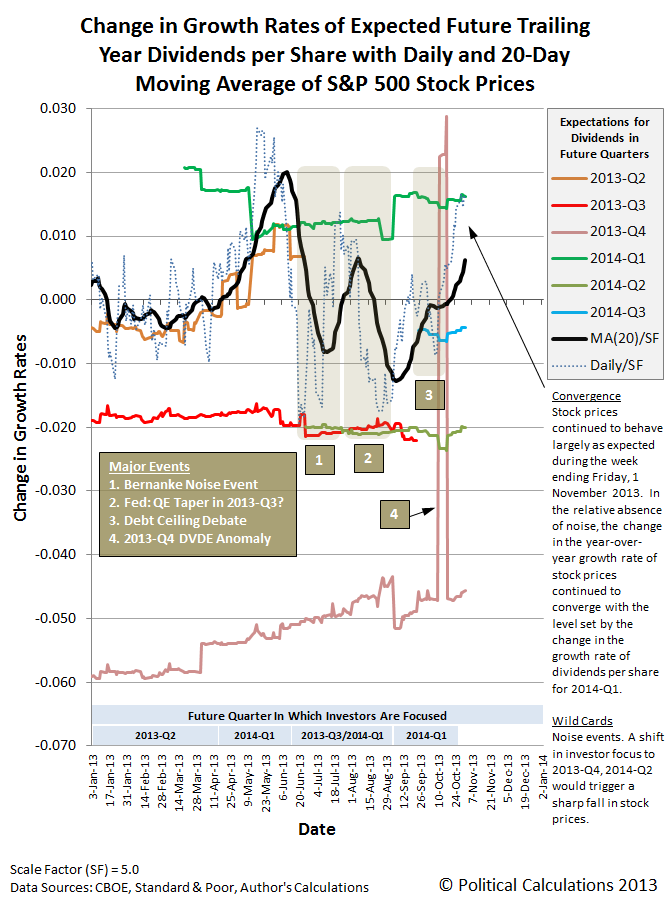
Once again, in the relative absence of noise that might drive stock prices off from where investors would otherwise set them, stock prices for the S&P 500 converged with the level of expectations for dividends in the first quarter of 2014:
From the chart above, we see that daily stock prices (shown by the dotted blue line) have converged with the green line representing the expected change in the year-over-year growth rate of dividends per share for 2014-Q1. If not for the noise events of the summer and fall of 2013, we would otherwise have seen stock prices moving within a relatively narrow margin of this particular future dividends trajectory.
Now that we're here, we would expect to see the recent rally in stock prices continue to rise for a bit before they begin to taper off and start bouncing about this level as the 20-day moving average catches up.
Analyst Notes
Following last week's correction, we went through all our spreadsheet data and found one other "drag right" formula error, this time affecting the calculation of the daily year-over-year growth rate of stock prices. The resulting changes in our chart above aren't greatly different from our previous version since we were using the 20-day moving average of stock prices from a year earlier as our base reference point, which really created the situation where the information we presented was "close, but not quite."
For all practical purposes, the main effect of the correction shows up in the form of slightly larger movements of the daily stock prices in the chart above. The most significant change is the degree to which the change in the growth rate of daily stock prices changed in connection with the Bernanke Noise Event.
With the correction, it is now evident that investors did indeed fully shift their forward-looking focus almost immediately to 2013-Q3 as the likely target date for when the Fed would begin to taper off its quantitative easing programs following Fed Chairman Bernanke's comments at his press conference on 19 June 2013. That was a premature reaction as far as the Fed was concerned, since Fed next expended a lot of effort at damage control to bring their attention back to 2014-Q1 over the following month before seemingly improving economic conditions led them to once again prematurely reopen that possibility.
Welcome to the blogosphere's toolchest! Here, unlike other blogs dedicated to analyzing current events, we create easy-to-use, simple tools to do the math related to them so you can get in on the action too! If you would like to learn more about these tools, or if you would like to contribute ideas to develop for this blog, please e-mail us at:
ironman at politicalcalculations
Thanks in advance!
Closing values for previous trading day.
This site is primarily powered by:
CSS Validation
RSS Site Feed
JavaScript
The tools on this site are built using JavaScript. If you would like to learn more, one of the best free resources on the web is available at W3Schools.com.
