Just two weeks ago, we reported that the number of dividend cuts being announced in this first quarter of 2016 was escalating quickly. In that same post, we also updated our chart showing the ongoing monthly count of the number of dividend cuts as reported by Standard & Poor that have taken place in the U.S. since January 2004, which confirmed that the pace of dividend cuts had once again crossed the threshold that indicates some degree of outright contraction is occurring in the U.S. economy.
That same chart also showed that the last time that the number of dividend cuts were below the level that would indicate some form of recessionary conditions being present in the U.S. economy was October 2013.
Keeping in mind that all of this information is, thanks to our regular reporting on the topic, really old news, we had to laugh as none other than the New York Times finally realized that an elevated number of dividends cut announcements do, in fact, indicate some degree of distress occurring in the nation's economy. Just 11 days after we scooped them on the basic story. Again.
Speaking of which, the pace of dividend cuts in the first quarter of 2016 has continued to escalate. Through Friday, 12 February 2016, the number of dividend cuts has risen into the "red zone" of our cumulative count of dividend cuts by day of quarter chart.
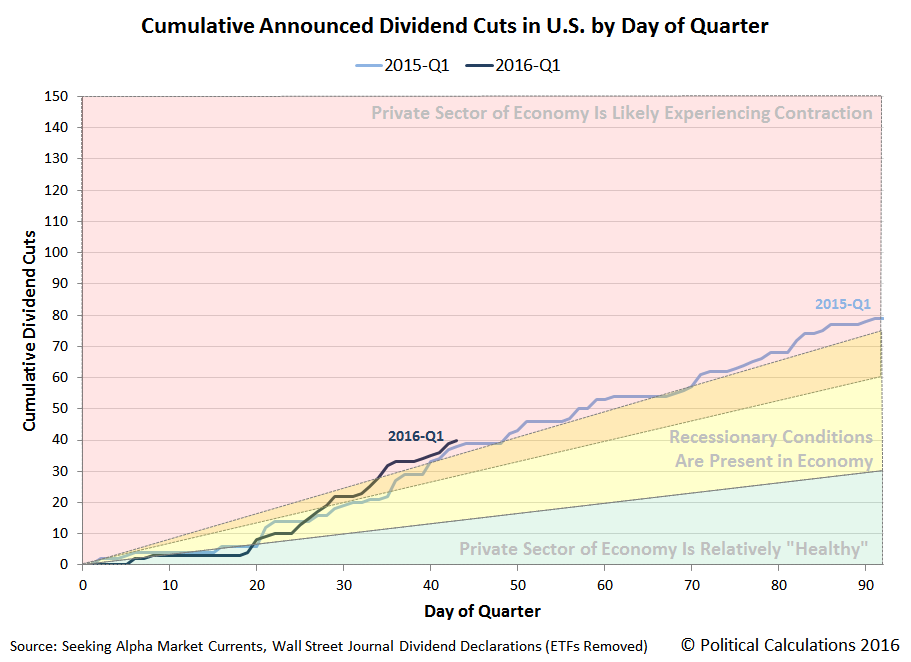
We observe that while the pace of dividend cuts in 2016-Q1 got off to a slower start than they did in same quarter a year earlier, they have escalated to their current level at a much faster pace than they did in 2015-Q1. At present, they are just slightly higher than they were at this same point of time last year.
Both quarters were in the contractionary red zone of our chart. In 2015-Q1, that corresponded to a quarter in which the real GDP growth rate is presently reported to be a cold 0.6%.
Of course, the last time the pace of cumulative dividend cuts announced in a quarter was even close to the pace seen in 2015-Q1 was 2015-Q4. Falling just short of 2015-Q1 in terms of badness, the first estimate of real GDP growth in the fourth quarter of 2015 was reported to be a similarly cold 0.7%.
Leaving behind now what the simplest and perhaps one of the strongest near real-time indicators of real economic distress is telling us about the recent history of the U.S. economy, let's jump straight into the latest twists and turns in the quantum random walk of U.S. stock prices.
Here were the major market driving news events of the sixth week of 2016, or if you prefer, the second week of February 2016!
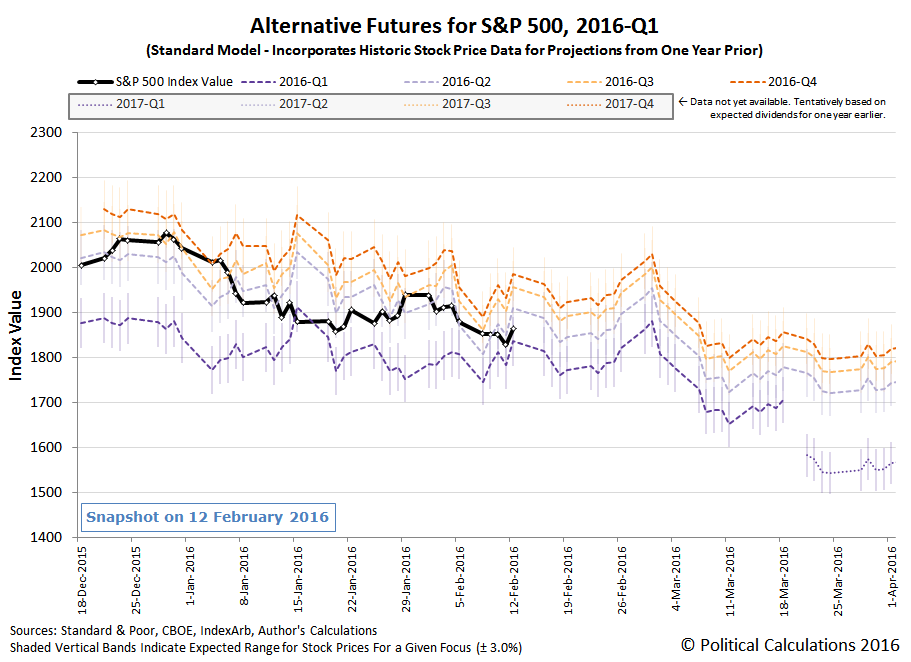
- 8 February 2016: With investors appearing to be focused on 2016-Q2 in our chart above (actually splitting their attention between the current quarter of 2016-Q1 and that more distant future quarter), stock prices moved downward as dimmer prospects for future growth gave investors little positive to go upon in a week where all eyes would be on Fed Chair Janet Yellen's scheduled Congressional testimony on Wednesday and Thursday.
- 9 February 2016: A classic day with little news and stock prices not really going anywhere as a result.
- 10 February 2016: Janet Yellen speaks softly, hinting that the Fed might slow its plans to hike short term U.S. interest rates further and prompting a rally, but alas, she kept speaking, and the market found she said some offsetting hawkish things in her first day of testifying before Congress, killing off what rally there was. The S&P 500 finished the day just below the level where it started.
- 11 February 2016: Bad news from global banks sends the U.S. dollar up and oil prices down, getting the day off to a bad start. They reach their low for the year, 1810.35, during the day at 2:38 PM Eastern Standard Time, when a rumor that OPEC will cut its oil production sent oil prices higher, boosting oil stocks. At the same time, the market digests the news that Yellen indicated that global market conditions might move the Fed to back off its planned interest rate hikes.
- 12 February 2016: That latter understanding took greater hold on Friday, as both oil stocks and financial stocks continued to rise on that belief. And then, New York Fed president Bill Dudley put the kibosh on that positive outlook, suggesting that he saw no reason for the Fed to not continue hiking rates, causing the rally to stall out at a level much lower than it might otherwise have gone. Still, the market held onto enough momentum to close up for the first time in four days, setting the stage for an opening bell gap up on Tuesday, 16 February 2016 following the U.S. Presidents Day holiday.
According to our model, which is giving us a truer read on the market now that we're beyond the short-term echo of past volatility that dogged us going into the last week, stock prices ended the sixth week of 2016 almost just as they began, with investors splitting their forward-looking attention between 2016-Q1 and 2016-Q2.
The good news though is that stock prices are likely to be less volatile over the next two weeks than they were in either January 2016 or in the first two weeks of February, at least in the absence of market driving news that might cause investors to suddenly shift their attention with little warning to more distant points of time in the future, which would be a good thing in the short term if that were to happen.
The bad news is that for that to happen, it would take some pretty bad news....
Labels: chaos, dividends, SP 500
Welcome to the blogosphere's toolchest! Here, unlike other blogs dedicated to analyzing current events, we create easy-to-use, simple tools to do the math related to them so you can get in on the action too! If you would like to learn more about these tools, or if you would like to contribute ideas to develop for this blog, please e-mail us at:
ironman at politicalcalculations
Thanks in advance!
Closing values for previous trading day.
This site is primarily powered by:
CSS Validation

RSS Site Feed
JavaScript
The tools on this site are built using JavaScript. If you would like to learn more, one of the best free resources on the web is available at W3Schools.com.
Other Cool Resources
Blog Roll


