"America's imports from China tumble by a record amount".
We're borrowing the lead sentence for this article from the headline that Business Insider attached to a Reuters news article in describing the U.S. Census Bureau's just-released data for the value of goods and services traded between China and the U.S. in February 2017.
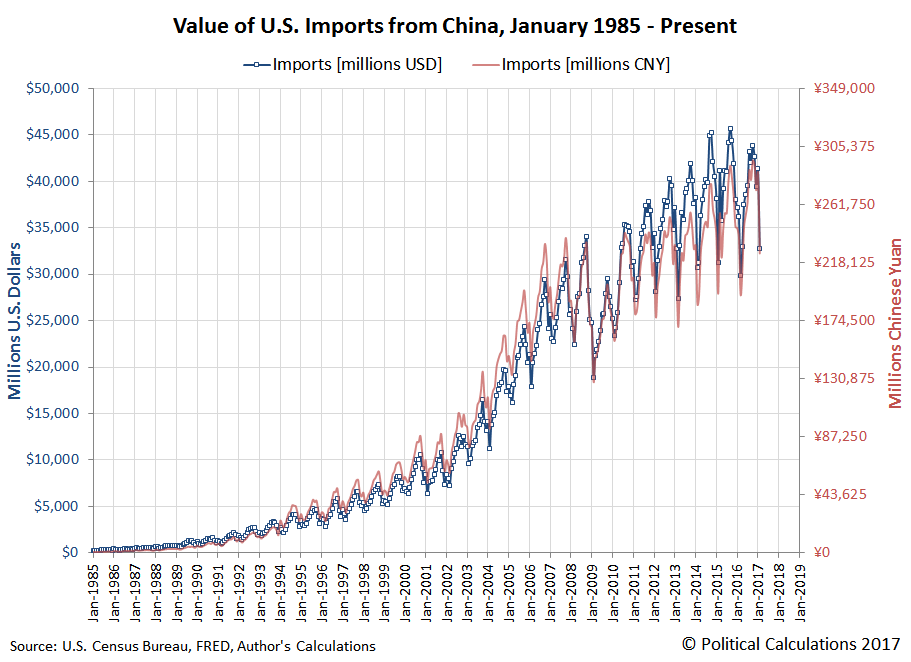
And a record amount it was! In January 2017, the U.S. imported nearly $41.4 billion worth of stuff, things and items from China, which dropped to nearly $32.8 billion in February 2017, marking a record month-to-month decline of just over $8.6 billion worth of imported Chinese goods.
In percentage terms however, we find that the month-to-month change from January to February 2017 only ranks seventh among the biggest month over month declines in goods imported to the U.S. from China since January 1985, so as records go, it's not as impressive as it could be.
While Business Insider's version of the article cited "slowing domestic demand" as the culprit, the Reuters article correctly recognized that "seasonal factors were likely behind the dramatic drop". We know that second scenario is the case because of the timing of this year's New Year/Spring Festival in China, which took place from 28 January 2017 through 2 February 2017, where the China's port facility workers who load goods onto U.S.-bound cargo ships were on holiday for the entire week. Combined with the two-to-three weeks that it takes America-bound goods to be transported from China's ports to their primary destination of U.S. west coast ports, February 2017 would have seen the amount of Chinese goods being unloaded in U.S. ports reduced by one week's worth of Chinese cargo ship traffic.
Taking the monthly value of China's imports to the U.S. for the past year and dividing by 4 (as the number of weeks in each month) would suggest that we should have expected the value of goods to drop by somewhere around $9.7 billion. Instead, they dropped by $8.6 billion, which means that the U.S. may have imported more goods from China than might have been reasonably expected for a month bearing the full effects of China's week-long New Year/Spring Festival holiday.
In any case, when we look at the exchange rate-adjusted, year-over-year growth rate for the value of goods exported from the U.S. to China and imported by the U.S. from China, we can reasonably expect the measured growth rate to rebound sharply in March 2017.
The U.S.' official trade data is coming out at the same time as China's Premier, Xi Jinping, is meeting with U.S. President Donald Trump to address trade issues, where the Chinese Premier has come bearing gifts, with concessions providing better access to China's markets for the U.S. financial service industry and eliminating a 2003 ban on U.S. beef. At the same time, the FT also reported over the weekend that the U.S. and China have agreed to a 100-day plan to resolve a number of other trade issues, which has taken the prospect of a trade war breaking out between the Earth's two largest national economies off the table.
Data Sources
Board of Governors of the Federal Reserve System. China / U.S. Foreign Exchange Rate. G.5 Foreign Exchange Rates. Accessed 5 April 2017.
U.S. Census Bureau. Trade in Goods with China. Accessed 5 April 2017.
Labels: trade
Welcome to the blogosphere's toolchest! Here, unlike other blogs dedicated to analyzing current events, we create easy-to-use, simple tools to do the math related to them so you can get in on the action too! If you would like to learn more about these tools, or if you would like to contribute ideas to develop for this blog, please e-mail us at:
ironman at politicalcalculations
Thanks in advance!
Closing values for previous trading day.
This site is primarily powered by:
CSS Validation
RSS Site Feed
JavaScript
The tools on this site are built using JavaScript. If you would like to learn more, one of the best free resources on the web is available at W3Schools.com.

