There are several different schools of thought for determining how much money you need to save to be able retire someday. Over the next several weeks, we'll explore what those schools are and what they tell you about how much wealth you need to stash away to be able to afford not ever having to work at a job again!
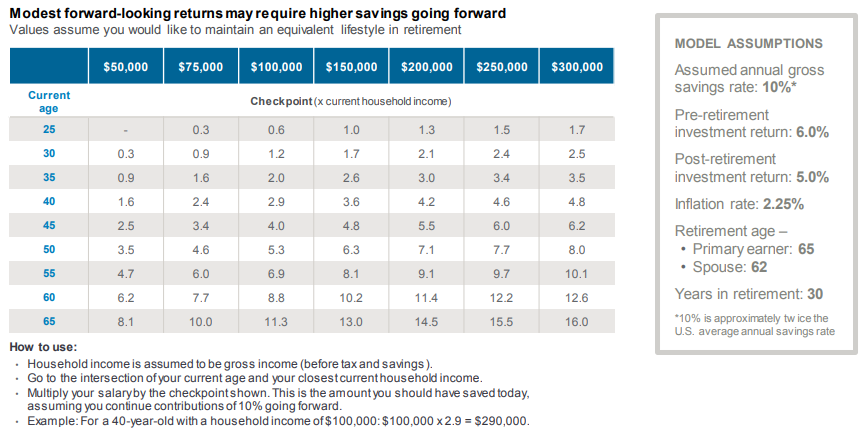
The first approach we'll check in with is the "income replacement" school, where how much you earn at your job determines how much you will need to save. This kind of approach is often championed by investment firms, like J.P. Morgan Asset Management, who provides the following illustration from their retirement guide to illustrate how much of your annual income you need in order to continue living as if you never stopped working when you retire.
The overall idea is have enough wealth built up by the time that you retire that, after you deduct expenses that you'll never have again, like commuting, work wardrobe, etc., will let you keep being able to spend money as if you never retired in the first place.
But accumulating the amount of money that you need to support the income replacement strategy is easier said than done over the decades of one's working life, where it can be difficult to know if you're on track.
To that end, J.P. Morgan provides the following table to indicate what your accumulated savings needs to be at certain age milestones and income levels to be able to generate the wealth you need to effectively replace your working income in retirement, based on how much they assume you're setting aside and the rates they project for both your investment returns and for inflation.
But we all know that the world doesn't cooperate quite like that, so the savings multiples indicated in the table can tell you how far away you might be if you choose to follow the income replacement strategy for preparing for your future retirement. We've built the following tool to approximate what those actual savings amount are for the age and income you choose to enter to get to that magic number quicker. If you're reading this article on a site that republishes our RSS news feed, please click here to access a working version of this tool at our site.
Our tool works best when covering the range of ages (25 to 65) and annual household incomes ($50,000 to $300,000) indicated on the milestone retirement savings chart. The further outside of those ranges you get, the less reliable the tool's results will be.
The downside of using the income replacement approach to determine how much you need to save up for retirement is that the real world can have very different ideas about how stable your income will be throughout your working life, what actual rates of return might be, and what inflation will be, to name just a few factors. You could easily find yourself in a position where you cannot reasonably attain the income replacement savings targets you might have set, because things change over time. Sometimes dramatically.
There are other approaches to saving for retirement to consider however, which we'll take on in upcoming parts of this series!
Welcome to the blogosphere's toolchest! Here, unlike other blogs dedicated to analyzing current events, we create easy-to-use, simple tools to do the math related to them so you can get in on the action too! If you would like to learn more about these tools, or if you would like to contribute ideas to develop for this blog, please e-mail us at:
ironman at politicalcalculations
Thanks in advance!
Closing values for previous trading day.
This site is primarily powered by:
CSS Validation
RSS Site Feed
JavaScript
The tools on this site are built using JavaScript. If you would like to learn more, one of the best free resources on the web is available at W3Schools.com.

