Existing home sales in the U.S. appear to have picked up some steam in September 2019, with the initial estimate of the seasonally-adjusted aggregate value of recorded sales across the U.S. rising to $1.56 trillion, matching the previous peak recorded back in March 2018.
The state level data for existing homes sales lags the national data for new home sales by a month, where we've observed the trends in both generally tracking each other, as might be expected. The state level data however provides a more granular view of the national data, where the state level existing home sales data can provide insights into how the nation's real estate markets are performing on a more local level.
We've broken the state-level trends down regionally, where we find the aggregate dollar total of sales in each ticked up in September 2019. The first two charts show the available data for the U.S. Census Bureau's Midwest and Northeast regions:
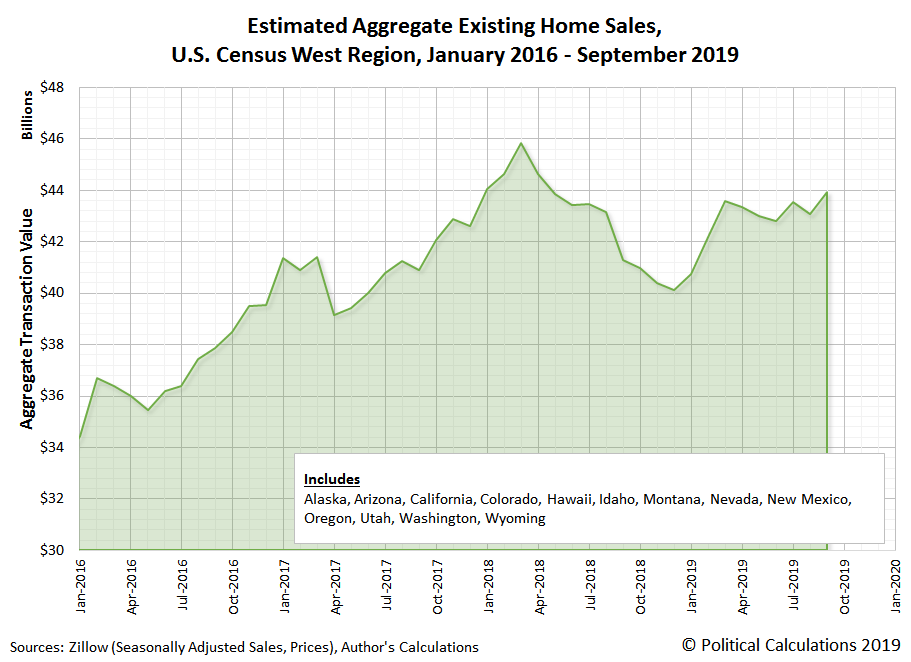
Similar upticks are visible in the West and South regions aggregate sales totals, although the largest month over month gain was observed in the South.
Looking in the South region, we find two major contributors. First, the downtrend that Texas' aggregate sales has been on for several months stalled in September 2019, eliminating a negative contributor to the region's data. Second, sales of existing homes in Florida, the second largest state market for real estate in the U.S., rose sharply.
Both states' data are provided in the following chart, where we've also presented the aggregate sales data for the remaining three other Top 5 state markets for existing home sales.
California, the nation's largest state real estate market, continues to tread water, with seasonally adjusted monthly sales totals over the last seven months falling within a narrow range between $22 billion and $22.5 billion. Meanwhile, New York, the fourth largest state for existing home sales, continued showing a rising trend, while sales in New Jersey, the fifth largest state, has largely drifted sideways during the last several months.
On a final note, we have to tip our hats to Zillow's research team, who have been steadily expanding their coverage of state-level real estate transactions, where as of their latest data release, they are now covering 49 states and the District of Columbia, with only Vermont's data not yet available. Their data makes our analysis possible and we greatly appreciate their work.
Labels: real estate
Welcome to the blogosphere's toolchest! Here, unlike other blogs dedicated to analyzing current events, we create easy-to-use, simple tools to do the math related to them so you can get in on the action too! If you would like to learn more about these tools, or if you would like to contribute ideas to develop for this blog, please e-mail us at:
ironman at politicalcalculations
Thanks in advance!
Closing values for previous trading day.
This site is primarily powered by:
CSS Validation
RSS Site Feed
JavaScript
The tools on this site are built using JavaScript. If you would like to learn more, one of the best free resources on the web is available at W3Schools.com.


