The S&P 500 (Index: SPX) closed at a new record high of 3,397.16 on Friday, 21 August 2020, the second time it set a new record during the week that was.
Which puts it in the lower half of the redzone forecast range in the alternative future chart, with the index' trajectory holding it just under the 3,400 level.
 - Snapshot on 21 Aug 2020")
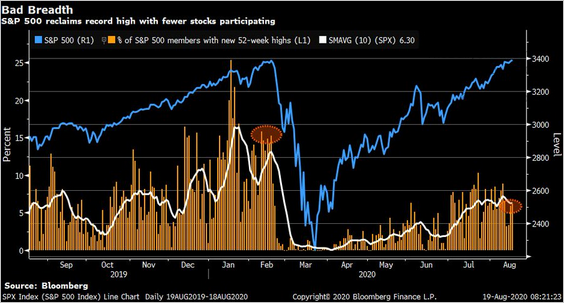
Despite setting new record highs, the rally the Fed has wrought has been remarkable for its lack of breadth, with just a single handful of stocks carrying the index to its new high. Or as Lance Roberts puts it, "the market has 'bad breadth'":
One of our primary concerns relating to the current elevation in the market has been extremely narrow participation. As Bob Farrell once quipped:
“Markets are strongest when broad, and weakest when narrow.”
There is little doubt that markets reek of “bad breadth.” As shown below, the market has achieved new highs with only a small percentage of the S&P 500 index participating.
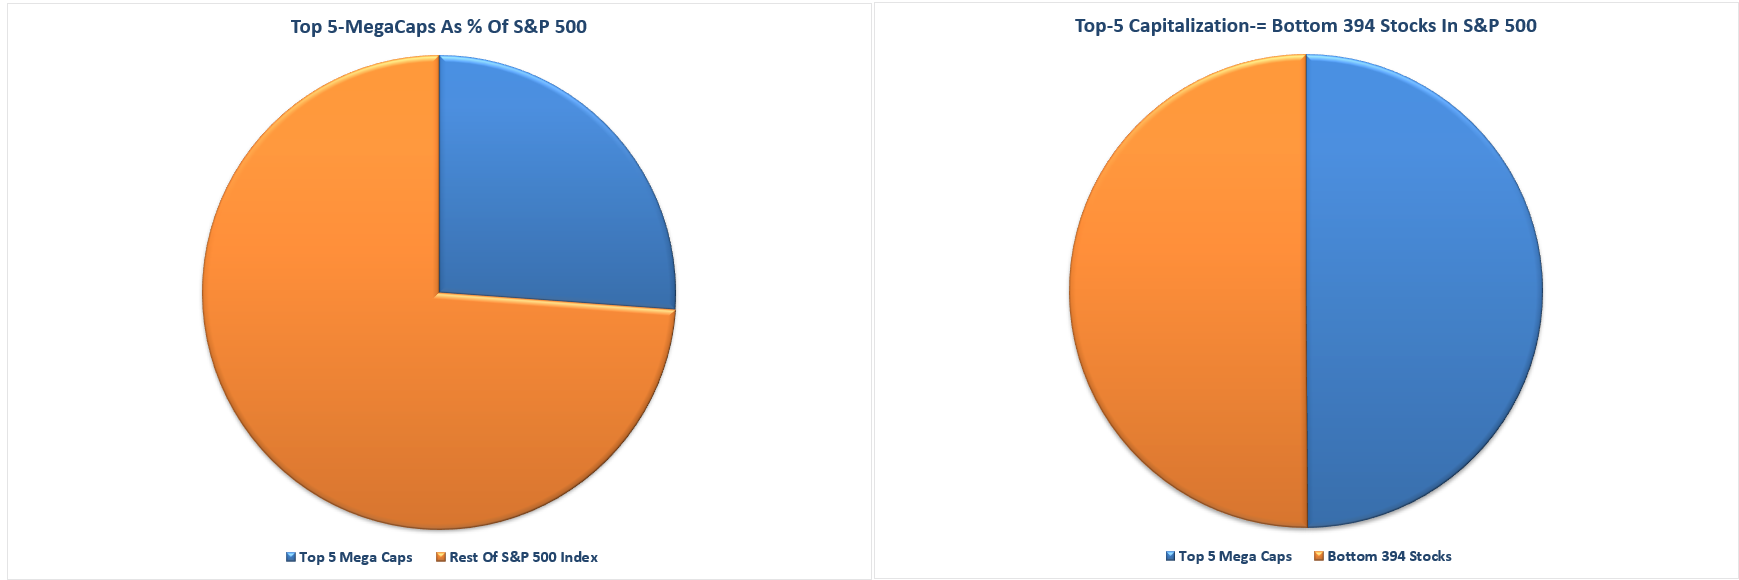
This “narrowness” is a result of the “passive indexing” effect on the markets which I explained in “Bulls Chant Into A Megaphone:”
“Currently, the top-5 S&P stocks by market capitalization (AAPL, AMZN, GOOG, FB, and MSFT) make up the same amount of the S&P 500 as the bottom 394 stocks. Those same five also comprise 26% of the index alone.”
“What investors are missing is that the top-5 stocks are distorting the movements in the overall index.
For each $1 put into each of those top-5 stocks, the impact on the index is the same as putting $1 into each of the bottom 394 stocks. Such is clearly not a true representation of either the market or the economy.”
If you really want to find the darkness lurking within the silver lining, you need to turn to ZeroHedge's take, which ends with the following cheery observation about the ratio of advancing/declining (A/D) stocks in the market:
... the last time we had a cluster of such negative A/D days with the S&P closing at all time highs was just days before the dot-com bubble burst.
But which you really need to click through to appreciate in all its gloomy glory. As for other gloom in the news, the week's headlines were somewhat short of imminent doom.
- Monday, 17 August 2020
- Daily signs and portents for the U.S. economy:
- Oil edges lower as suppliers try to hold line on output cuts
- As U.S. homebuilder confidence matches record high, mortgage delinquencies rise
- Bigger trouble still developing in Japan, Thailand:
- Instant View: Japan's economy shrinks at record pace as pandemic hits spending
- Thailand suffers biggest economic slump since 1998, government announces more stimulus
- Bigger stimulus still developing in China:
- China approves 11 fixed-asset investment projects worth $5.5 billion in July
- China central bank injects 700 billion yuan of MLF loans, rates steady for fourth month
- Nasdaq hits record high close due to tech rally
- Tuesday, 18 August 2020
- Daily signs and portents for the U.S. economy:
- Bigger trouble still developing in China, Eurozone:
- S&P warns of rising real rates risk to China's recovery
- German engineering exports plunge in second-quarter as pandemic takes toll: VDMA
- ECB minion has dark view of Eurozone bank health:
- https://www.reuters.com/article/us-usa-stocks-s-p500-graphic/big-tech-drives-sp-500-to-record-high-in-coronavirus-rally-idUSKCN25E2BO
- Wednesday, 19 August 2020
- Daily signs and portents for the U.S. economy:
- Oil slips as demand worries outweigh U.S. stocks draw
- Japan's exports tumble as U.S. demand collapses, order books shrink
- U.S. official sees 'real desire' for smaller coronavirus relief bill
- Fed minion promotes useful diversity at central bank, other minions anticipate more easing ahead, but Fed minutes seem to close door on Yield Curve Control for now:
- Fed's Bowman says diversity helps central bank policy
- Several Fed policymakers see more easing ahead to help brace economy
- Fed's Barkin says uncertainty is weighing on U.S. outlook
- Exclusive: Fed's Bullard - Wall Street 'about right' as U.S. muddles through virus risk
- Yield curve control: even less likely, for now
- Wall Street ends lower after Fed minutes highlight tough recovery
- Thursday, 20 August 2020
- Daily signs and portents for the U.S. economy:
- Oil falls 1% on OPEC+ oversupply, U.S. jobless data
- China, United States agree to hold trade talks, Chinese commerce ministry says
- Rise in U.S. weekly jobless claims clouds labor market recovery
- Bigger trouble brewing, bigger stimulus quantified in China:
- China's Supreme Court slashes ceiling of legal private lending rate
- China's outstanding loans to small businesses up 27.5% year-on-year by end-July
- Fed minion fixing to speak on Fed's future:
- Nasdaq closes at all-time high as strong tech sector offsets jobless data
- Friday, 21 August 2020
- Daily signs and portents for the U.S. economy:
- Oil falls 1% on sluggish coronavirus recovery, supply concerns
- China promised to follow Phase One trade deal, Pompeo says
- U.S. business activity surges to early 2019 levels: Markit flash PMI
- Congressional panel urges Fed and Treasury to take more risk with Main Street program
- Bigger trouble developing in the Eurozone:
- Euro zone economic recovery falters in August
- France delays launch of COVID-19 economic reboot plan to September
- S&P 500, Nasdaq end at records after upbeat business surveys
But wait, that's not all! Don't miss Barry Ritholtz' latest list of positives and negatives he found in the week's economics and markets news!
Welcome to the blogosphere's toolchest! Here, unlike other blogs dedicated to analyzing current events, we create easy-to-use, simple tools to do the math related to them so you can get in on the action too! If you would like to learn more about these tools, or if you would like to contribute ideas to develop for this blog, please e-mail us at:
ironman at politicalcalculations
Thanks in advance!
Closing values for previous trading day.
This site is primarily powered by:
CSS Validation

RSS Site Feed
JavaScript
The tools on this site are built using JavaScript. If you would like to learn more, one of the best free resources on the web is available at W3Schools.com.
Other Cool Resources
Blog Roll


