How many migrants have unlawfully crossed the U.S. border into Arizona during the Biden-Harris border migration crisis?
That's a question we realized we might be able to answer using the state's detailed COVID-19 data after seeing the surge in detentions along the southwestern border since January 2021. The trick to doing that lies in converting the number of excess COVID-19 cases in the state arising from the incoming migrants into a back-of-the-envelope estimate of their total number.
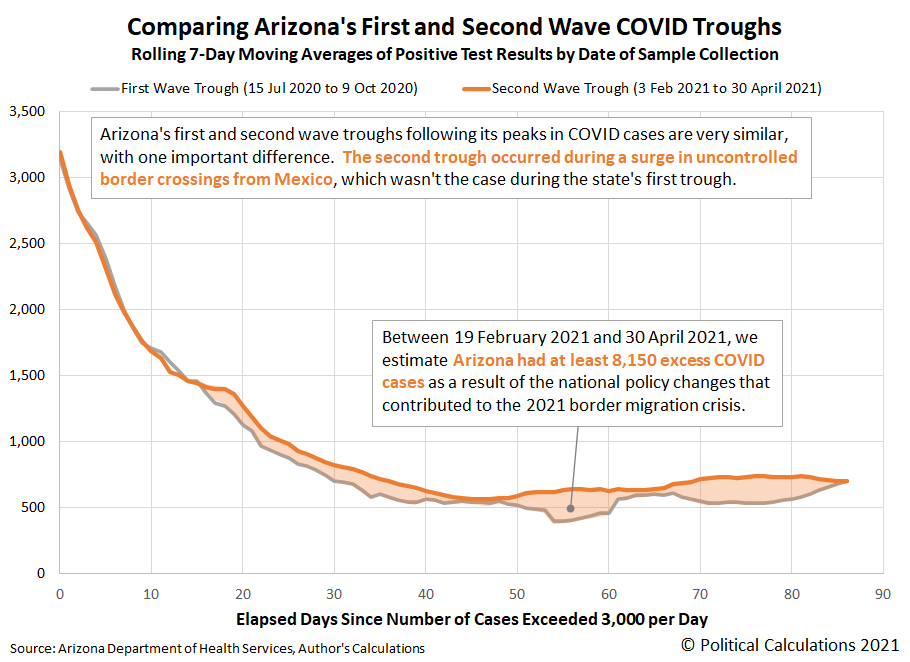
We've previously estimated that from 19 February 2021 through 30 April 2021, Arizona has recorded at least 8,150 excess COVID-19 cases because of the border migration crisis, as shown in the following chart, based on the difference between Arizona's first and second troughs following its recorded peaks in COVID cases:
That number includes the incoming migrants and also Arizona residents who might have been infected with the SARS-CoV-2 coronavirus from their encounters with any infected migrants who entered Arizona during these months, where the real number would be a percentage of that figure. That's something we can reasonably estimate. Once we have that number, we can divide it by the percentage of migrants in the U.S. government's detention facilities with COVID-19, which the Federal Emergency Management Agency indicated was "less than 6% positive" in mid-March 2021. Doing so will give us an estimate of the number of "surplus" migrants who have entered Arizona during the border migration crisis.
The rest is as easy as building a tool to do that math. Which we did, so you can supply the one missing piece of information we don't have: the percentage of Arizona's excess COVID-19 cases represented by the incoming migrants. We've set a conservative estimate default value of 50% in the following tool, which you can change as appropriate. Then click the "Calculate" button to generate your estimate (if you're accessing this article that republishes our RSS news feed, please click here to access a working version on our site).
Using the 50% default value, we estimate some 67,916 surplus migrants entered Arizona since the end of January 2021. That's a little shy of 1% of Arizona's estimated 2020 population of 7.4 million. If the percentage is higher, it's no wonder the Biden-Harris administration is taking steps to contain the negative impacts from its policies.
The following 15-minute video report describes how ICE's mishandling of COVID-19 fueled outbreaks around the country:
Many of the factors described in the video report have played out in Arizona since early February 2021 with the Biden-Harris administration's border migration crisis.
Labels: demographics, math, tool
Welcome to the blogosphere's toolchest! Here, unlike other blogs dedicated to analyzing current events, we create easy-to-use, simple tools to do the math related to them so you can get in on the action too! If you would like to learn more about these tools, or if you would like to contribute ideas to develop for this blog, please e-mail us at:
ironman at politicalcalculations
Thanks in advance!
Closing values for previous trading day.
This site is primarily powered by:
CSS Validation
RSS Site Feed
JavaScript
The tools on this site are built using JavaScript. If you would like to learn more, one of the best free resources on the web is available at W3Schools.com.
