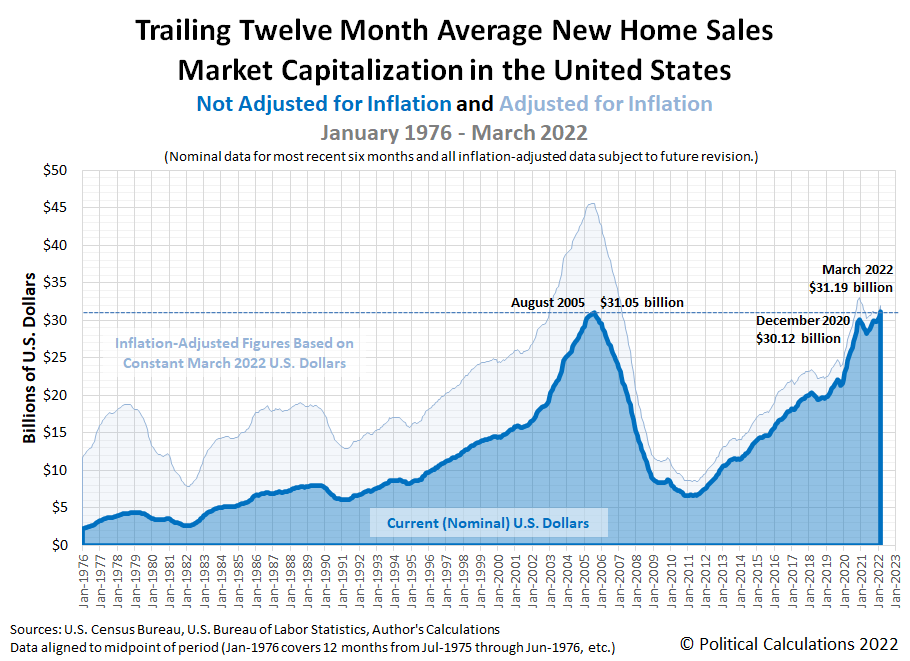
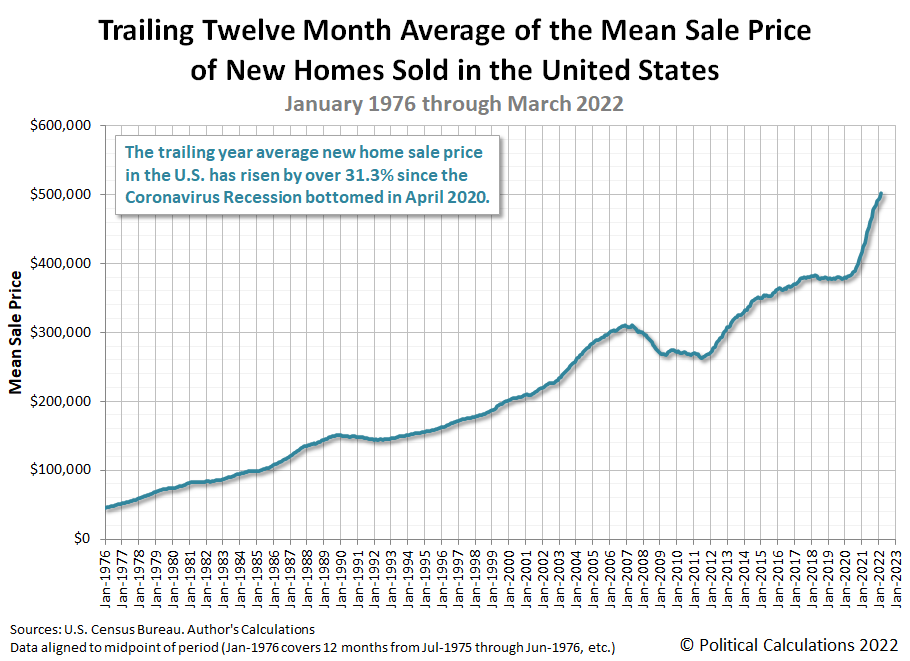
A combination of record high new home sale prices and an upward trend in the number of new homes sold as buyers raced to beat rising mortgage rates caused the market capitalization of the U.S. new homes market to surge in March 2022.
In doing that, the market cap of new homes in the U.S. surpassed its previous nominal, non-inflation adjusted record. Political Calculations' initial estimate of the U.S. new homes market cap is $31.19 billion. That figure is 0.45% higher than the previous record of $31.05 billion set in August 2005 during the peak of the first U.S. housing bubble.
The following chart shows what that new record looks like in the context of the new home market cap history since January 1976:
March 2022 also saw significant upward revisions for the number of new homes sold in January and February 2022, which were coupled with small adjustments in the average new home sale prices during these months. Overall, the trailing twelve month averages for both new homes sales and average new home sale prices continued their recent upward trends.
The trailing twelve month average for new home sales removes the effects of annual seasonality from this data, while the math helps smooth the month-to-month noise in new home sale prices, making it easier to identify trends for both data series. Note the number of new home sales is still well below its recent November 2021 peak. The market capitalization of new homes sold in the U.S. has broken its nominal housing bubble era record mainly because of the contribution of rapidly inflating new home sale prices.
Since new home sales are counted toward GDP when their sales contracts are signed, a rising trend in the market cap for new homes represents an economic plus for the U.S. economy. The National Association of Home Builders estimates new homes sales represent 3% to 5% of the nation's Gross Domestic Product.
Labels: real estate
Welcome to the blogosphere's toolchest! Here, unlike other blogs dedicated to analyzing current events, we create easy-to-use, simple tools to do the math related to them so you can get in on the action too! If you would like to learn more about these tools, or if you would like to contribute ideas to develop for this blog, please e-mail us at:
ironman at politicalcalculations
Thanks in advance!
Closing values for previous trading day.
This site is primarily powered by:
CSS Validation
RSS Site Feed
JavaScript
The tools on this site are built using JavaScript. If you would like to learn more, one of the best free resources on the web is available at W3Schools.com.


