Is there a better way to weight stocks within a market index?
Modern portfolio theory suggests that the optimal way to weight stocks within an index is according to their market capitalization, where the percentage representation of each company within a particular index is based on the product of its share prices and number of shares outstanding with respect to the total sum of all the market capitalizations of the companies whose stocks make up the index. Examples of market cap-weighted indices includes the S&P 500 and the Nasdaq 100 (Ticker: QQQQ).
There are, of course, other ways to weight the holdings of the stocks of individual companies within a market index. For example, the Dow Jones Industrial Average (Ticker: DJI) is a price-weighted index. There are also equal weighted indices, in which the number of shares of each component stock within the index is periodically adjusted so that each represents the same market capitalization.
A little over 10 years ago however, Rob Arnott of Research Affiliates introduced a new method for setting the weight of each stock within a market index, called fundamental indexing. Here, instead of using either market cap or price, stocks within the index would be weighted according to fundamental measures of their companies' business performance, such as their revenue, dividend rates, or book values.
Here is the promise of fundamental indexing that Arnott noted back in 2006, based on his analysis of the 1,000 stocks that made up his proposed index:
How consistent is this approach? It's awfully consistent. During economic expansions, you add almost two percent a year. During recessions -- when you most need those returns -- you add three and a half percent. During bull markets you add 40 basis points. You don't really add anything in bull markets, because they are driven more by psychology than by the underlying fundamental realities of the companies. And so during bull markets you keep pace. Which is good; it's important. During bear markets you find yourself adding 600 to 700 basis points per annum. Bear markets are when reality sets in and people say, "Show me the numbers." Bear markets are when this really comes on strong. Also, during periods of rising rates, two and a half percent added. During periods of falling rates, one and a half percent added.
Soon, it became possible to invest in Arnott's new kind of index, where the first one was an Exchange Traded Fund based on his original 1,000 stocks, Powershares RAFI US 1000 ETF (NYSE: PRF). The follwwing chart compares the relative performance of the fundamentally weighted PRF against the price weighted DJI and the market cap-weighted S&P 500 over its entire history.

In this chart, we see that through the close of trading last Friday, 14 October 2016, the relative value of the fundamentally weighted PRF was up by 84.15% over its initial 30 December 2005 value, while the Dow Jones Industrial Average was 66.78% higher and the S&P 500 was 68.15% higher.
But we also see that there were periods where DJI either outperformed or performed as well as PRF. We also noticed that most of the PRF's gains over the market cap-weighted S&P 500 came in 2009, so we wondered how the relative performance of the PRF has fared since that time. So, we reset the chart to show the relative performance of each major type of index to begin in January 2010. The next chart shows what we found.

We see that PRF has outperformed both the S&P 500 and DJI over the period covered in this chart, having risen to be 96.32% above its 8 January 2010 level, compared to the S&P 500's 93.48% and the DJI's comparatively lackluster 73.23%. Meanwhile, we also confirm that much of PRF's relative outperformance over the longer period of time with respect to the S&P 500 occurred as an almost singular event in mid-2009, when whatever factors boosted it also boosted the DJI.
What this outcome suggests is that the considerable outperformance of PRF during 2009 has not been replicated in the years since, where through 14 October 2016, it has largely found itself within spitting distance of the performance of the S&P 500.
And yet, the fundamentally weighted PRF has generally performed either equivalent to or slightly better than the market capitalization weighted S&P 500 over that time.
As an investment then, it has some very attractive qualities that suggest a place for it in one's long term holdings. However, the near-performance of PRF with either the DJI or the S&P 500 over shorter durations means that it will be important to consider other factors, such as transaction costs, when choosing between investing in these different kinds of indices.
On a final note, we've been wanting to get back to this particular investing topic for some time, where the last time we discussed it here was back in August 2006!
What can we say? Some of our analytical projects have very long development periods!
Labels: fundamental indexing, investing, SP 500


Not long ago, index fund pioneer John Bogle challenged Wharton business school professor Jeremy Siegel's claim that an index fund whose component stocks are weighted within the fund according to a fundamental business metric, such as revenues or dividends, would outperform a traditional market capitalization-weighted index. (HT: Greg Mankiw.)
The core of Bogle's argument is that the new investing strategy represented by the fundamentally-weighted indices is little more than the latest in a long series of investing fads, with a major knock against it - namely, higher expenses in the form of taxes and fees.
Leaving aside the "investing fad" argument, which only time can judge, a question we can better answer with the data on hand is this: "Will a fundamental-weighted index fund outperform a traditional market index enough to cover its additional costs?"
The oldest fundamental-weighted index fund is the RAFI 1000 index exchange traded fund, which trades under the symbol PRF. This ETF has been trading since December 2005 and offers the longest track record against traditional indices involving real money as opposed to historical data mining. (Note: WisdomTree, with whom Siegel is affiliated, has only been offering its own line-up of fundamental-weighted ETFs since June of this year, which doesn't really allow enough time to see how well its funds are performing.) The following chart shows the PRF's performance as of August 25, 2006 against the "big-three" stock market indices: the Dow Jones Industrials (DJI), the S&P 500 (GSPC, which which the ETF is most comparable), and the Nasdaq (IXIC):

Is PRF's better performance over the time from when the ETF was launched on December 19, 2005 enough to cover its premium in costs compared to the traditional index funds?
In the chart above, we see that the fundamental-weighted PRF has outperformed the DJI by roughly 1.5-2.0%, the S&P 500 by roughly 3% and the Nasdaq by roughly 10%. All while demonstrating less volatility than these other indices.
The RAFI 1000 index is rebalanced annually, which means its costs from tax-based events (capital gains and losses from the stocks it sells) should be equivalent to those of the other major indices. It does however have a much higher expense ratio than that of a traditional index fund - 0.60% compared to 0.15% for a typical S&P 500 index fund. What this means is that PRF must outperform other indices by at least 0.45% to be able to cover these costs.
So far, it seems its performance is justifying its premium, as its returns are high enough to outweigh its higher costs. Not a bad start, but again, only time will tell if fundamental-weighted indexing turns out to be an investing fad.
Labels: fundamental indexing, investing
Last year, Political Calculations copied and pasted, ahem, presented Rob Arnott's speech discussing his research (available as a 408KB Word document) into the performance of stock market index funds whose composition of individual stocks is weighted according a fundamental business measure, such as aggregate revenues or book values, instead of the weighting stocks within the fund by market capitalization, as is done with major indices like the S&P 500.
Since then, Powershares Capital Management has launched an Exchange Traded Fund (ETF) based upon Arnott's indexing strategy, FTSE RAFI U.S. 1000 Portfolio (NYSE: PRF). The following chart illustrates the new ETF's performance with respect to the S&P 500, Nasdaq and Dow indices since its inception in December 2005:
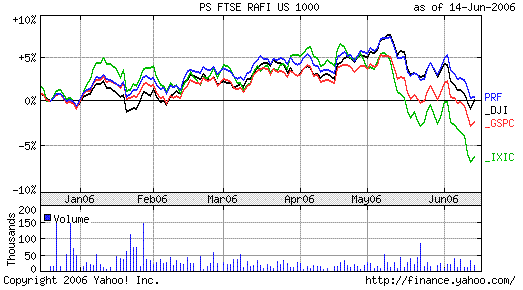
As we can see in the chart above, the PRF index so far seems to offer somewhat better performance with less volatility than the price-weighted Dow and the market capitalization-weighted S&P 500 and Nasdaq indices. But this performance begs a question: if weighting individual stocks within an index according to fundamental business measures works better than traditional methods of weighting stocks in an index, why aren't there more such funds, including funds with different weighting metrics?
The answer is: they're on the way. Powershares plans to offer nine additional fundamental-weighted funds, but focused upon applying Arnott's fundamental-weighting technique to the individual sectors of energy, basic materials, industrials, consumer goods, health care, consumer services, telecommunications and technology, utilities, and financials.
Meanwhile, investment firm WisdomTree is seeking to create its own series of fundamentally-weighted indices, with significant input from Princeton professor Jeremy J. Siegel, author of Stocks for the Long Run and The Future for Investors. Siegel provides a taste of WisdomTree's pending offerings writing in the Wall Street Journal ($ only, excerpt via Econlog):
...According to my research, dividend-weighted indexes outperform capitalization-weighted indexes and are particularly valuable at withstanding bear markets. For example, the Russell 3000 Index lost almost 50% of its value between the bull market peak of March 2000 and the October 2002 low. Over this same period, a comparable total market dividend-weighted index was virtually unchanged. A dividend weighted index did have a bear market, but it only corrected by 20%. Moreover, the dividend-weighted index bear market didn't start until March 2002, and it lasted only six months (compared to 24 months for the cap-weighted index). The dividend-weighted index is now about 40% above its March 2000 close, whereas the S&P 500 and Russell 3000 are still not yet back to even. A similar performance occurred in other bear markets.
The historical data make an extremely persuasive case for fundamental indexing. From 1964 through 2005, a total market dividend-weighted index of all U.S. stocks outperformed a capitalization-weighted total market index by 123 basis points a year and did so with lower volatility.
But do these fundamental-weighted indices really offer better performance? Arnott suggests that "if his index had existed from 1962 through 2003, it would have beaten the S&P 500 by 1.9 percentage points annually." Jason Zweig notes:
For all of indexing's idiosyncrasies, Arnott's version just adds new ones. His emphasis on big companies with lots of physical assets and loads of employees gives his index a tilt toward value stocks, at least compared with the S&P. Who knows whether that stock-picking method will work as well in the next 42 years as it has in the past 42?
Writing in Kiplinger's Personal Finance, Steven Goldberg reports analyst Baie Netzer's conclusion that "the main reason the back-tested new index did so well is that it has a value tilt -- that is, it loads up more on undervalued stocks than does the S&P 500."
As Arnott is the first to point out, that's the point:
The index is intended to serve as a counterpoise to the S.& P. 500, which is weighted by market capitalization, or the stock market value of a company's outstanding shares. While the S.& P. 500 dropped by a cumulative 11 percent from 2000 to 2004, the RAFI notched a total return of 45 percent over the same five years, he said.
The S.& P.'s market-cap metric, he said, causes it to consistently overweight highfliers and to underweight bargain-priced shares. In that respect, the tail can wag the dog, causing the index to present a distorted picture of the market, he said.
"The S.& P. 500 gets whipsawed by every bubble when it inflates and when it deflates," he said.
Mr. Arnott says his index offers a better picture of the stock market's prospects because it underweights overvalued stocks and overweights undervalued shares.
Labels: fundamental indexing, investing
John Mauldin writes one of the most thought-provoking weekly newsletters related to investing. This past week's newsletter is no exception, as he focuses on the work of Research Affiliates chairman and editor of the Financial Analysts Journal Rob Arnott, who has recently authored a study with Jason Hsu and Phil Moore evaluating the performance of the economic theories that underlie the construction of today's major stock market indices, such as the S&P 500. The study is available at the Research Affiliates' web site as a 1.3MB PDF document. What follows below are excerpts taken from a speech given by Rob Arnott at Mauldin's Accredited Investor Strategic Investment Conference in April 2005, as reported by Mauldin in his newsletter. Emphasis and links added are mine.
Any given economic theory will perfectly describe the world as long as you agree with the underlying assumptions. More often than not, however, the underlying assumptions take us from the real world into a world of, well, theory.
One of the most famous theories is the capital asset pricing model (or CAPM). It is the basis for a number of index models, especially capitalization weighted indexes like the S&P 500.
Now, for most of us, our biggest bet is in equities. Is theory leading us astray here? Let's suppose we have a perfect crystal ball. It can't tell us the share prices of every asset a year from now, or two years from now, but it can tell us the cash flows into the future on every investment we could make. The crystal ball lets us calculate the true fair value of every asset in the market. If we know the true fair value, then the market value will match that, the capital-asset pricing model will be correct, and the index will be perfectly efficient, in the sense that there is no way to boost returns without boosting risk.
Now let's suppose our crystal ball is just a little bit cloudy and we can't see the future precisely. Then what winds up happening is that every asset is trading above or below true fair value. We can't know what true fair value is. But we can know that every stock, every asset, every bond is going to be trading above or below what its ultimate true fair value is. Even the most ardent fans of the efficient markets hypothesis would say, "That's reasonable. That's reality."
Now if every asset is trading above or below its true fair value, then any index that is capitalization-weighted, (price-weighted or valuation-weighted) is automatically going to have us overexposed to every single asset that's trading above its true fair value and underexposed to every single asset that's trading below its true fair value.
So this is the first time we've circled back to some concrete implications for the market. It means that capitalization-weighted indexes on which our entire industry relies, are fundamentally, structurally flawed and will inherently overweight every stock that's above fair value and underweight every stock that's below fair value.
Now let's look at what that does to returns. If you put most of your money in assets that are above fair value, you have proportionately too little in assets that are below fair value, and you're getting a return drag. The cap-weighted indexes are producing returns that are below what they should be, below what would be available in a valuation-indifferent index.
If you construct an index that is valuation-indifferent, that doesn't care what the PE ratios are, that doesn't care what the market capitalization is, then return drag disappears -- and you can quantify it. It's about two to four percent per year. And how many managers out there reliably add two to four percent per year in the very long run? Darn few of them.
Now while it's a bad index, equal weighting will outperform a cap-weighted index. A lot of folks think that equal-weighted indexes outperform mainstream capitalization indexes because they have a small-stock bias. The theory being that small companies beat large because they have a value bias, and cheap stocks outperform expensive ones. That's not quite correct. What equal weighting does is underweight every stock that's large, regardless of whether it's cheap or dear, and overweight every stock that's small, regardless whether it's cheap or dear. This means that from a valuation perspective every stock that's overvalued is overweight in the cap- weighted index, and in the equal-weighted index it's a crap shoot, 50/50. You have even odds, whether it's overvalued or undervalued, of being over- or underweight.
Let's look at this from the vantage point of a concrete example. Let's suppose we have a world with two stocks. Each has a true fair value of a hundred bucks, but the marketplace doesn't know what the true fair value is. One stock is estimated by the market to really be worth fifty bucks and the other is estimated to really be worth a hundred and fifty, but both valuations are wrong. Capitalization weighting puts 75 percent on that overvalued stock.
Now suppose over the next ten years, today's valuation errors are corrected. Both stocks move to a hundred dollars, but a new 50-percent error is reintroduced because news has come along and people have been drawn into the hype that one company looks really good and the other looks really bad. These errors are introduced into the pricing, and you have a steady state: the size of the errors stays steady, but the old errors have been corrected. In that world, the estimated cap-weighted return is zero, and the equal-weighted return is 33 percent.
Mauldin describes the math behind Arnott's 33% return: "Both stocks start at $50 and $150 for a total portfolio of $200. In ten years, both stocks are worth $100. If you cap weighted your portfolio, you would not have made anything. If you put an equal $100 into the companies, you would have made $100 on the lower priced stock and lost $33 on the higher priced stock, for a portfolio profit of $67 on your original $200. Thus Rob's 33% return."
Returning to Arnott's comments:
In the May, 2005 issue of the Financial Analyst Journal, I published a short study in which I looked back over the last 80 years and asked the question, "How often does the number-one-ranked company in market capitalization outperform the average stock over the next one year, three years, five years, and ten years?" And the simple answer seems to be that on average, over time, about 80 percent of the time, the largest-capitalization company underperforms over the next ten years.
Now the magnitude of that underperformance is in the 40 to 50 percentage-point range -- it's huge. The largest-capitalization company, on average, underperforms the average stock by 40 to 50 percentage points over the next ten years. You'd expect the same pattern but less reliably in the top ten companies. Some of the top ten will deserve to be there; their true fair value is higher. Some of them will not deserve to be there. This symmetric pattern of errors will push many that don't deserve to be there into that top ten, and some of the ones that do deserve to be there, out of the top ten.
What do we find? On average, over time, seven out of ten of the top-ten stocks under-perform the average stock over the next ten years, and three out of ten outperform. Meaning three out of ten probably deserved to be in that top ten. The average underperformance: 26 percentage points over the next ten years. So this is huge.
Now, how do we reconcile the fact that capitalization-weighted portfolios are market clearing -- that is they span the entire market, they cover everything in exactly the proportion that the market owns those assets -- with a return drag that is so easy to eliminate?
This gets back to finance theory and the capital-asset pricing model. I had a discussion with the originators of the model. There were two notable originators: a fellow named Jack Treynor and a fellow named Bill Sharp. And Bill Sharp's take on this was very simple, and that's that this couldn't possibly be. Jack Treynor's take on it was just as simple: "Wow, this is neat, this is correct, let me write a paper on it documenting why it works." So a very different reaction from the two co-founders of the capital-asset pricing model.
But the simple fact is, the capital asset pricing model works if your market portfolio spans everything: every stock, every bond, every house, every office building, everything you could invest in on the planet including human capital, including the net present value of all of your respective labors going into the future. There's no such thing as an index like that, it doesn't exist. So right off the bat you can say that the S&P 500 is not the market, and anyone who says that it's efficient because it is the market is missing the point: it's not the market.
Can we improve on cap weighting? Absolutely! Any index that is replicable, objective, and focused on large and liquid companies which are easily tradable is a potentially useful index. Any such index that is valuation-indifferent should beat the stock market. If it doesn't care what PE ratios are or what the price is when setting how large your investment in an asset should be, it should beat cap weighting.
What could you do that would do that? You could look at book values. Find the thousand largest companies by book value and create an index weighted by book value. Never mind what the price is, never mind what the market capitalization is, simply do it by book value. You could do it based on revenues: which companies have the highest revenue base or sales, and then weight them by revenues or sales. You could even do it based on head count. What are the thousand biggest employers in the United States? How many people do they employ, and weight the index by the number of employees.
You can do anything of this sort, anything that captures the scale of a company, so you have a bias towards large and liquid companies that is replicable and objective but that doesn't pay attention to valuation. Does it work? You bet. The graph below shows that the thousand largest by capitalization over the past 43 years, the red line, would have taken every dollar you invested and turned it into 70 dollars. Well that's awesome, that's what a quarter-century bull market from '75 to '99 does -- the biggest bull market in US capital markets history. Taking a dollar to seventy dollars is remarkable. But if you use any of these other measures, any of them, you do roughly twice as well. In fact a little better than twice as well for the average: 160 dollars for every dollar at starting value. It's a huge gap. Look also at what happened after '99. The S&P 500 is still down 10 percent in total return including income. Fundamentally weighted indexes: up 30 percent.
Here is a small version of the graph Arnott describes above. Click the image for a slightly larger and clearer version:

Returning again to Arnott's comments:
So fundamental indexing does appear to offer structural advantages over conventional capitalization weighting. How does it work over time?.... The S&P 500 comes in at 10.53 percent a year over the last 43 years. The reference cap -- the thousand largest by cap without the ministrations of the committee that selects which companies make it into the S&P -- stands about 0.18 percent lower, at 10.35 percent per annum. The average of the fundamental indexes? The worst of the fundamental indexes produces a 12 percent annual return, much better than the conventional indexes. And the best produce almost 13 percent -- the average is 12.50 with excess returns of 2.15 percent.
Mauldin notes that "reference cap is what Rob uses to mean his universe of the largest 1000 stocks." His newsletter also contains the tables illustrating the data cited by Arnott above, including the statistical correlation data (t-statistics) that preface Arnott's following comments:
How consistent is this approach? It's awfully consistent. During economic expansions, you add almost two percent a year. During recessions -- when you most need those returns -- you add three and a half percent. During bull markets you add 40 basis points. You don't really add anything in bull markets, because they are driven more by psychology than by the underlying fundamental realities of the companies. And so during bull markets you keep pace. Which is good; it's important. During bear markets you find yourself adding 600 to 700 basis points per annum. Bear markets are when reality sets in and people say, "Show me the numbers." Bear markets are when this really comes on strong. Also, during periods of rising rates, two and a half percent added. During periods of falling rates, one and a half percent added.
There's some more, but the excerpts provided above cover the main points of Arnott's paper and speech. The full text of Mauldin's newsletter with all tables and graphs illustrating Arnott's points is available at Investors Insight.
It's certainly food for thought when considering what to do with your investment portfolio!
Labels: fundamental indexing, investing
Welcome to the blogosphere's toolchest! Here, unlike other blogs dedicated to analyzing current events, we create easy-to-use, simple tools to do the math related to them so you can get in on the action too! If you would like to learn more about these tools, or if you would like to contribute ideas to develop for this blog, please e-mail us at:
ironman at politicalcalculations
Thanks in advance!
Closing values for previous trading day.
This site is primarily powered by:

CSS Validation

RSS Site Feed

JavaScript
The tools on this site are built using JavaScript. If you would like to learn more, one of the best free resources on the web is available at W3Schools.com.
Other Cool Resources
Blog Roll


