It has been very busy behind the scenes here at Political Calculations (more on that later this week), as we've been working on a lot of different fronts.
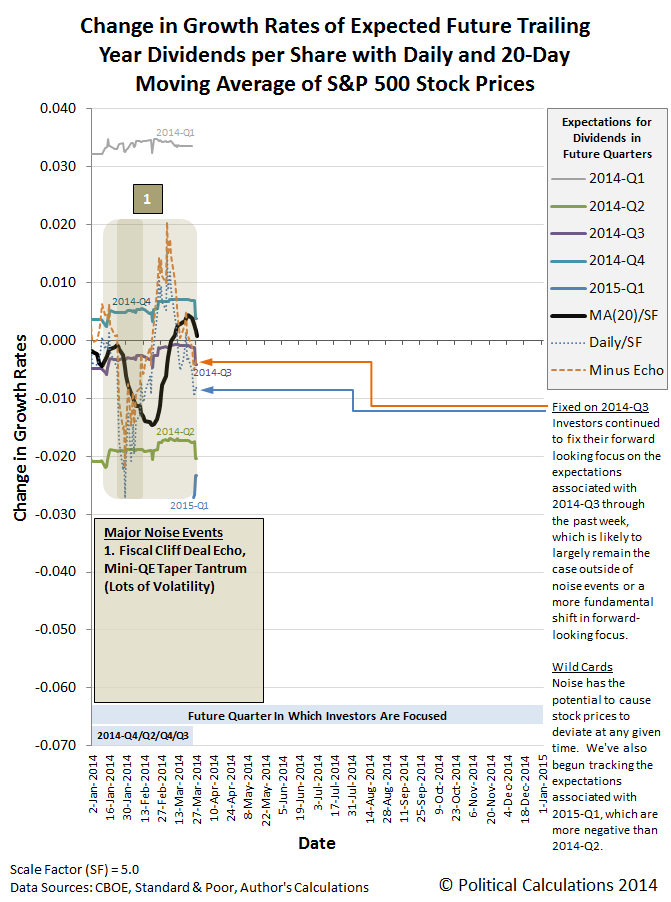
First and foremost, we've updated our chart showing the changes in the year-over-year growth rates for the future's expected trailing year dividends per share (perhaps better thought of as simply "investor expectations") and the change in the growth rates of S&P 500 stock prices.
Here's the quick summary of changes:
- We've rolled the dates from the previous version of the chart six months to the left, which means this version of the chart will cover all of 2014.
- Data for the dividends per share expected for 2015-Q1 became available in the past week, which is now shown on the chart.
- We've "grayed out" the data for 2014-Q1, since the first quarter of 2014 is now fully in the rear view mirror. The last time investors had focused on that quarter in setting stock prices was back in mid-November 2013.
We've also modified our method of accounting for the echo effect upon the growth rates of stock prices to be more adaptive. Here, the previous editions of the chart treated the size of the echo effect as if it were a constant value, which has worked out okay through this point, but we're coming up on a period after the end of April 2014 where the effect will be particularly pronounced, where continuing that approach be less than optimal.
Speaking of the future, investors would still appear to be focused on the future quarter of 2014-Q3 in managing their expectations for setting today's stock prices. That's also clear in the echo-filtered alternative futures chart below:

And for those who would like to consider what the future looks like beyond the end of this week, we've projected the future based on the snapshot of futures we took on 28 March 2014 forward another three months to the end of 2014-Q2:
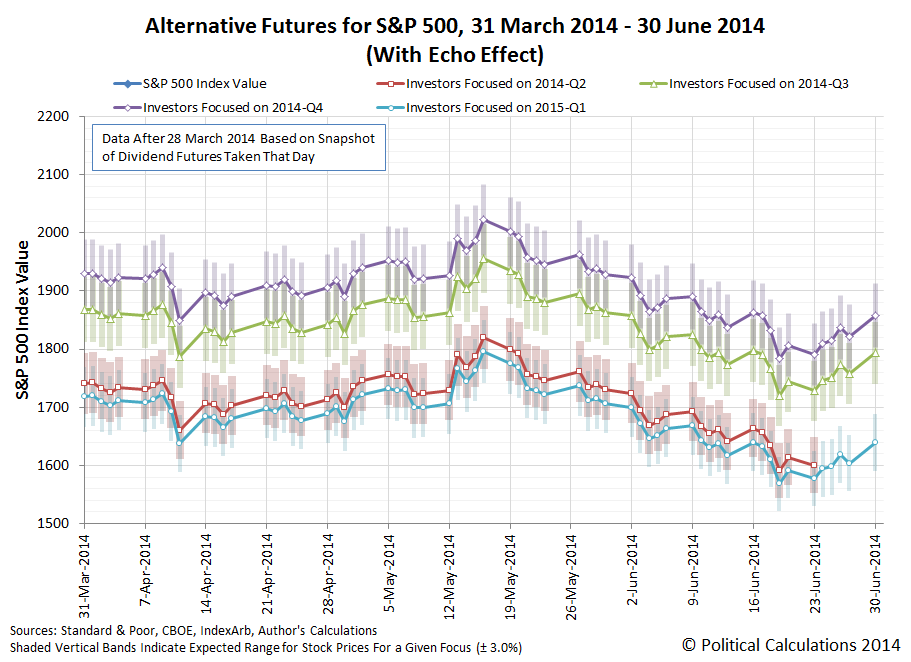
Pick your future and set your expectations accordingly!
Welcome to the blogosphere's toolchest! Here, unlike other blogs dedicated to analyzing current events, we create easy-to-use, simple tools to do the math related to them so you can get in on the action too! If you would like to learn more about these tools, or if you would like to contribute ideas to develop for this blog, please e-mail us at:
ironman at politicalcalculations
Thanks in advance!
Closing values for previous trading day.
This site is primarily powered by:
CSS Validation

RSS Site Feed
JavaScript
The tools on this site are built using JavaScript. If you would like to learn more, one of the best free resources on the web is available at W3Schools.com.
Other Cool Resources
Blog Roll


