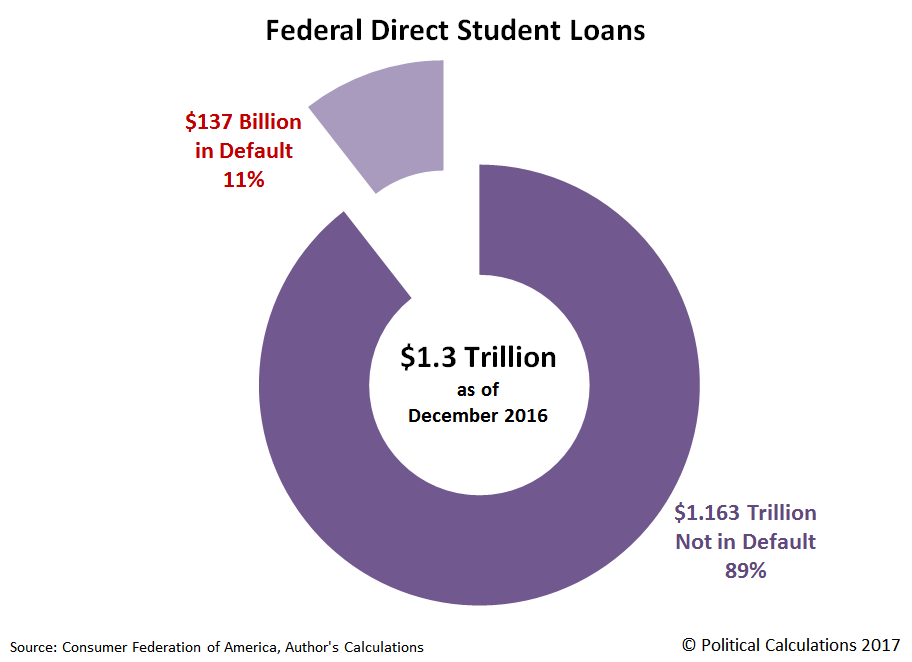
The Consumer Federation of America recently put out a press release that reports that they've found that 1.1 million student loan borrowers in the United States have gone 270 or more days without making payments on their Federal Direct Student Loans, with more than $137 billion worth of the loans issued by the U.S. government now qualifying as being in default by that standard.
Update 27 April 2017: The figure of 1.1 million defaults only applies to the number of student loans that went into default during 2016. Altogether, through December 2016, there were a total of 4.2 million student loans in default, the combined balance of which adds up to $137 billion. We're afraid that the CFA missed noting that total figure in their press release, and we've updated our charts and analysis accordingly to reflect the corrected total of for the number of Federal Direct Student Loans in default.
Data from the CFA's press release has made the rounds among multiple news outlets, but we have a pretty basic question: Are those big numbers?
They certainly seem like big numbers, what with all the millions and billions being thrown about, but how do these numbers fit into the bigger U.S. government-issued student loan story?
We decided to dig down into the press release's details to find out. Let's start with the biggest numbers, where we discover that $137 billion worth of Federal Direct Student Loans are in default, against the larger total of $1.3 trillion worth of Federal Direct Student Loans that have been issued through the end of December 2016.
Here, we calculate that the percentage of student loans that have gone 270 or more days without having had a payment made upon them represents about 11% of the total amount borrowed. That means that some 4.2 million people whose student loans require that they make some sort of scheduled payment went more than 9 months without making any.
To tell if that's a big number or not requires that we put that number into some kind of context. Here, we'll draw on the U.S. Federal Reserve's data for the delinquency rates on loans and leases issued by all commercial banks in the U.S., where for the fourth quarter of 2016, we find that the total delinquency rate is 2.04%. That value had previously peaked at 7.4% back in the first quarter of 2010, following the bottoming of the Great Recession.
But another important thing to consider is that delinquency rate would include all private-sector issued loans and leases that have payments that are past due, including those that have gone without payment for much less than 270 days. That figure tells us that the default rate of 11% for Federal Direct Student Loans is, to put it in Trumpian terms, "Yuge!"
Going by the standard of simple delinquency, the WSJ reported back in April 2016 that 40% of student loan borrowers were delinquent on their scheduled student loan payments, meaning that they were at least 15 to 31 days behind.
The next question that we'll tackle is whether the 4.2 million student loan borrowers who have defaulted on making payments on their Federal Direct Student Loans is a lot. The following chart shows how they fit into the total number of 42.4 million Americans who have taken out Federal Direct Student Loans.
Click here to see the previous version of this chart, which only broke out the 2016 defaulters.
Here, we discover that the 4.2 million Americans that have defaulted on their Federal Direct Student Loans is about 10% of the total number of Americans who have borrowed money from the U.S. government to pay for a university or college education in the United States, and that the 1.1 million defaults in 2016 represent 3% of the total.
What we find here is that a relatively small portion of the total population of federal student loan borrowers is responsible for the very high default rate for the Federal Direct Student Loan program. 38.2 million, or 90% of student loan borrowers, have not gone 270 days or longer without making their scheduled student loan payments to Uncle Sam's hired student loan servicers.
The combination of low number of defaulters and relatively large amount of defaulted student loans tells us that these individuals have truly racked up what might be considered to be gargantuan hefty student loan debt. Let's next find out how much debt that is.
Click here to see the previous version of this chart, which divided the full $137 billion of defaulted student loans among 2016's defaulters.
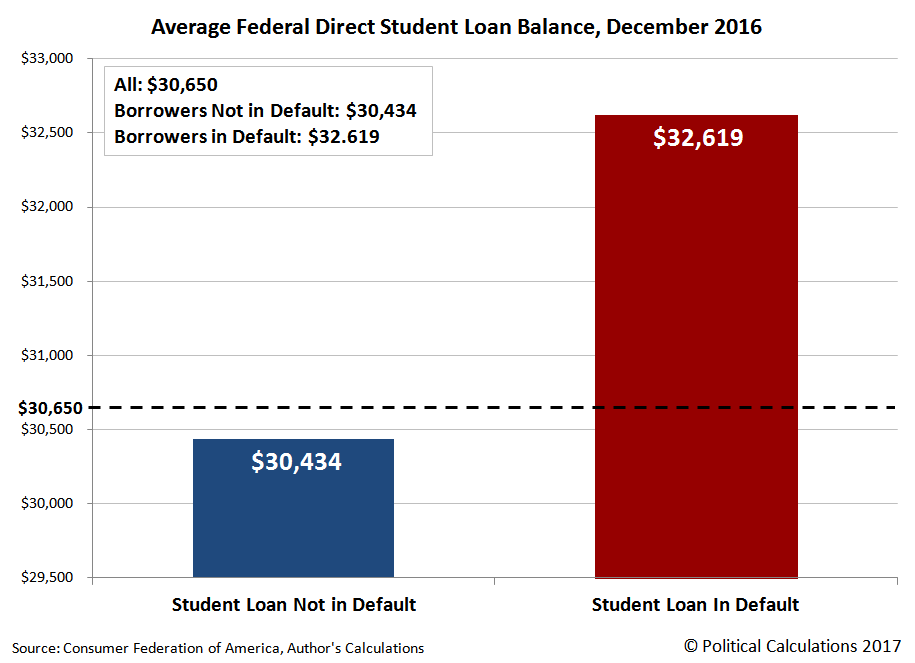
The average student loan balance in the U.S. is $30,650. For Americans who haven't defaulted on their student loans, that average figure drops to $30,434. But for Americans who have defaulted on their payments to their U.S. government creditor, the average balance on their Federal Direct Student Loan is $32,714.
To put that latter number into context, consumer personal finance site Nerdwallet reports that the average amounts of debt for the U.S. households that report having the indicated kind of debt for 2016:
- Credit cards: $16,748
- Mortgages: $176,222
- Auto loans: $28,948
- Student loans: $49,905
- Any type of debt: $134,643
The average amount of a Federal Direct Student Loan in default for a single American is nearly double the amount of credit card debt for the combined accounts of Americans living in a single household. It also exceeds the average amount of the combined auto loans held by American households.
But maybe the most scary aspect of the average balance of a defaulted Federal Direct Student Loan is that only $2,280 separates that loan gone bad from the average balance of a student loan that is not in default.
Because the U.S. Department of Education, which administers the Federal Direct Student Loan program, borrows money through the U.S. Treasury to issue these student loans, it must charge all borrowers a higher rate of interest to make up the $137 billion gap in its direct student loan program that is caused by a small minority of borrowers, or else U.S. tax revenue must either be diverted or additional money borrowed to make up the difference in paying back the U.S. government's creditors.
The U.S. student loan implosion therefore has a very real cost to both U.S. taxpayers and to Americans seeking to borrow money from the U.S. government to pay for their higher education.
Labels: data visualization, education, personal finance
Welcome to the blogosphere's toolchest! Here, unlike other blogs dedicated to analyzing current events, we create easy-to-use, simple tools to do the math related to them so you can get in on the action too! If you would like to learn more about these tools, or if you would like to contribute ideas to develop for this blog, please e-mail us at:
ironman at politicalcalculations
Thanks in advance!
Closing values for previous trading day.
This site is primarily powered by:
CSS Validation
RSS Site Feed
JavaScript
The tools on this site are built using JavaScript. If you would like to learn more, one of the best free resources on the web is available at W3Schools.com.


