March 2023 saw a turn for the worse for the shareholders of dividend-paying companies in the U.S. stock market. Unlike the preceding month, when we could point to some bright spots, March was more uniformly dismal for dividend payers.
That's because favorable dividend actions are down by every measure. Month over month. Quarter over quarter. Year over year.
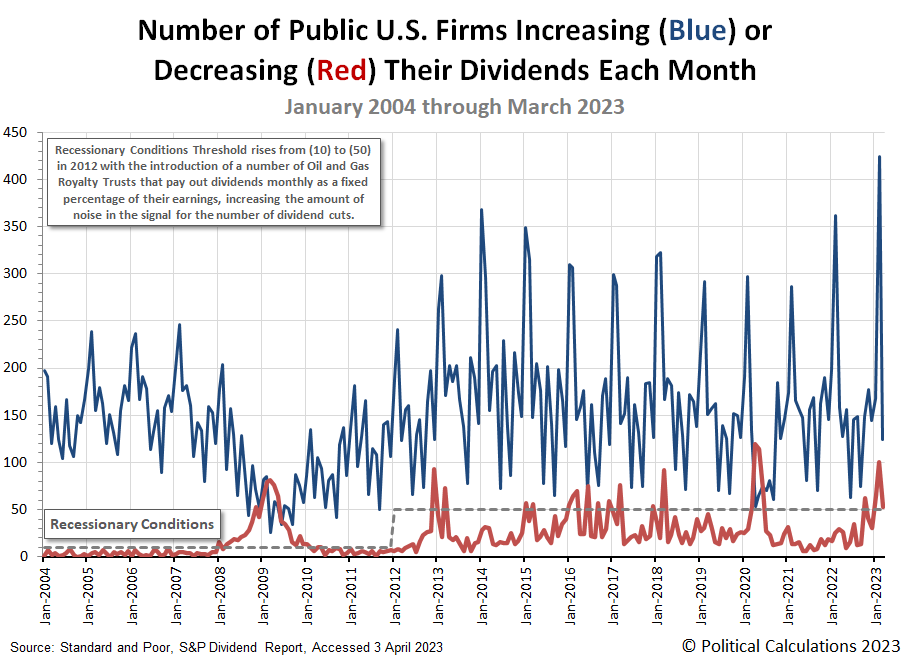
And though unfavorable dividend actions are down compared to February 2023, they are still at levels consistent with the development of recessionary conditions in the U.S. economy.
The latest update to Political Calculations' chart presenting the number of U.S. firms that announced they would either increase or decrease their dividends each month illustrates these changes. It also shows that March 2023 had fewer dividend increases announced during it than any previous March during the previous ten years.
The following table presents March 2023's dividend metadata, showing how much each measure has changed both Month-over-Month (MoM) and Year-Over-Year (YoY):
| Dividend Changes in March 2023 | |||||
|---|---|---|---|---|---|
| Mar-2023 | Feb-2023 | MoM | Mar-2022 | YoY | |
| Total Declarations | 4,654 | 5,186 | -532 ↓ | 4,438 | 216 ↑ |
| Favorable | 173 | 539 | -366 ↓ | 243 | -70 ↓ |
| - Increases | 124 | 424 | -300 ↓ | 158 | -34 ↓ |
| - Special/Extra | 44 | 111 | -67 ↓ | 72 | -28 ↓ |
| - Resumed | 5 | 4 | 1 ↑ | 13 | -8 ↓ |
| Unfavorable | 53 | 100 | -47 ↓ | 29 | 24 ↑ |
| - Decreases | 53 | 100 | -47 ↓ | 29 | 24 ↑ |
| - Omitted/Passed | 0 | 0 | 0 ↔ | 0 | 0 ↔ |
Following up our observation about how Standard & Poor' may be reporting dividend omissions last month, we've found evidence to support the possibility the firm is grouping them with the dividend decreases they report. BK Technologies (NYSE: BKTI) very specifically suspended their ordinary dividends on 16 March 2023, yet S&P indicates zero omitted dividends for March 2023, continuing the streak set since June 2021. We suspect these passed or omitted dividends are being grouped under the category of dividend decreases, which is appropriate if you consider both dividend cuts and omissions count as unfavorable dividend actions, but would be nice to have them broken out separately because they represent different mechanisms by which dividend-paying companies act to conserve money when their earnings dry up.
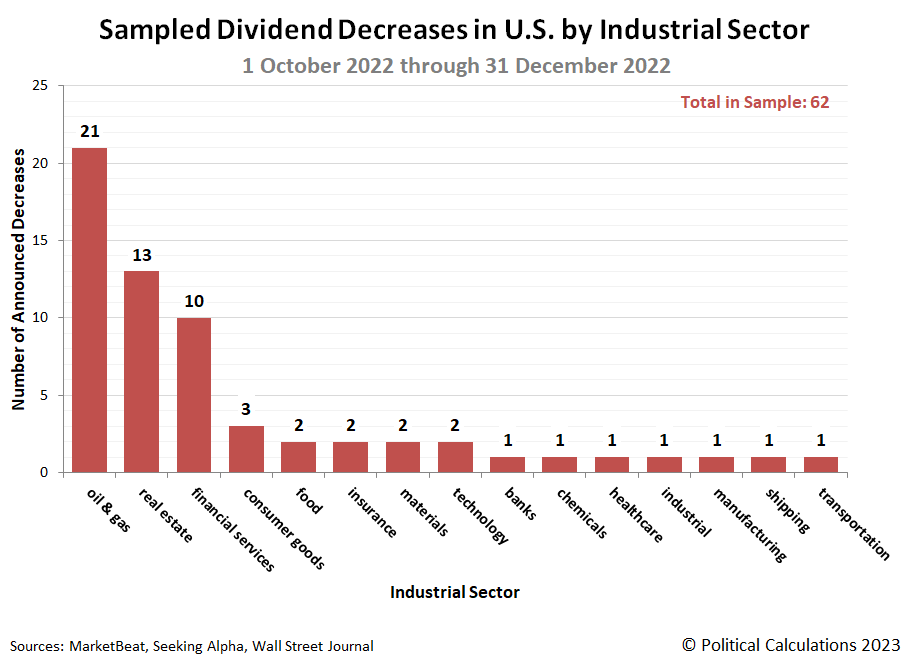
Our sampling of unfavorable dividend changes captures 14 of the reported 53 actions. There were four reductions each in the real estate and oil & gas sectors, and two in the financial services industry that rises to three if we include banks, which we count separately.
Here's the list for our sampling, where we also find industrial representation from the food, industrial, shipping, and technology sectors of the economy.
- AAON (NASDAQ: AAON)
- Great Ajax (REIT-Mortgage) (NYSE: AJX)
- Great Elm Capital (NASDAQ: GECC)
- Sabine Royalty Trust (NYSE: SBR)
- Eagle Bulk Shipping (NASDAQ: EGLE)
- Bridge Investment Group Holdings (NASDAQ: BRDG)
- AMEN Properties (OTCPK: AMEN)
- Calavo Growers (NASDAQ: CVGW)
- Manhattan Bridge Capital (REIT-Mortgage) (NASDAQ: LOAN)
- BK Technologies (NYSE: BKTI)
- Permian Basin Royalty Trust (NYSE: PBT)
- PermRock Royalty Trust (NYSE: PRT)
- Western Asset Mortgage Capital (REIT-Mortgage) (NYSE: WMC)
- Invesco Mortgage Capital (REIT-Mortgage) (NYSE: IVR)
Looking back over the past three months, our sampling provides the following picture to indicate which industries are experiencing the greatest amount of distress:
The oil and gas sector has seen the lionshare of dividend reductions, showing the negative impact of 2022's oil price collapse upon it. Meanwhile, the real estate and financial services industries represent the second and third highest levels of concentrated distress in the U.S. economy, with these sectors bearing the brunt of the Federal Reserve's year-long series of rate hikes.
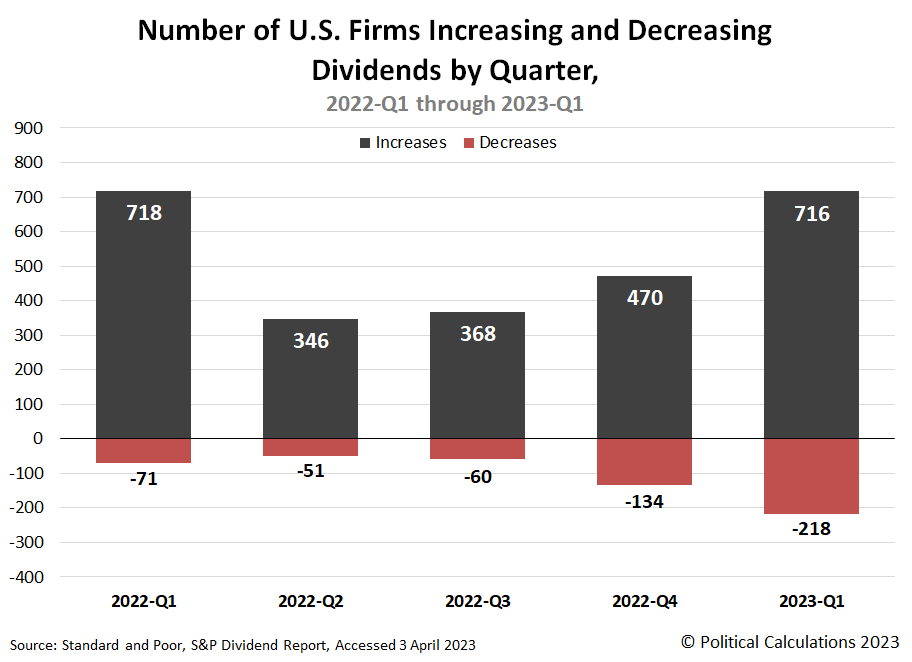
We'll conclude by tallying up the quarterly number of dividend increases and decreases, showing how 2023-Q1 compares with the four quarters preceding it. We saved this chart for the end of this article for a reason: it visualizes the downward momentum that has built up in the U.S. stock market since 2022-Q1.
Will 2023-Q2 see a turnaround in the outlook for dividend paying companies? Or will the downward momentum established over the past year continue?
These are rhetorical questions. Deep down, you already know which outcome is more likely for the next quarter.
References
Standard and Poor. S&P Market Attributes Web File. [Excel Spreadsheet]. 3 April 2023.
Labels: dividends
Welcome to the blogosphere's toolchest! Here, unlike other blogs dedicated to analyzing current events, we create easy-to-use, simple tools to do the math related to them so you can get in on the action too! If you would like to learn more about these tools, or if you would like to contribute ideas to develop for this blog, please e-mail us at:
ironman at politicalcalculations
Thanks in advance!
Closing values for previous trading day.
This site is primarily powered by:
CSS Validation
RSS Site Feed
JavaScript
The tools on this site are built using JavaScript. If you would like to learn more, one of the best free resources on the web is available at W3Schools.com.


