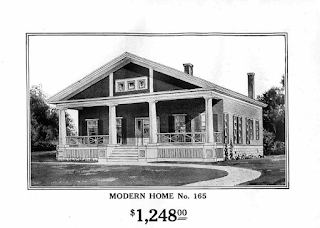
One hundred and twelve years ago, Americans could buy a house straight out of the Sears catalog. One such example from the the 1911 Search Catalog is "Modern Home No. 165", which anyone with $1,248 could buy. Land not included, some assembly required. Electricity, plumbing fixtures, etc. available as add-on options.
That's the equivalent of $40,158 after adjusting this figure to be in terms of 2023's U.S. dollar. It's also 3.7 times the average income per capita of $333 for an American in 1911.
Even though it wasn't included, since land was dirt cheap at the time, that cost of would be considered very affordable today. We estimate the trailing twelve month average of the median new home sold in July 2023 is a little shy of 5.6 times the income of a family earning the trailing twelve month average of the median household income in the U.S.
Flipping that ratio, the median household income is about 18% of the value of the median new home being sold in the U.S. in recent months. Believe it or not, that's an improvement in this raw measure of relative affordability for new homes, which bottomed at 16.9% in December 2022.
The raw measure of affordability has been improving because the median sale price of new homes has been falling, while median household income has been rising.
Of course, the "raw" relative affordability is only relevant to new home buyers who don't need a mortgage. Since most new home buyers do in fact need to take out a mortgage to buy a house in today's real estate market, we need a more refined measure of relative affordability. We calculate the monthly mortgage payment for a new home sold, assuming a zero percent down payment and the average mortgage rate for the month, and divide that result by monthly median household income. For July 2023, because mortgages rates rose, the mortgage payment for a new home sold at the median price recorded in the U.S. would consume over 41% of the monthly income of a family earning the median household income.
That puts the typical new home sold in the U.S. well out of the affordable reach of the typical American household.
It also puts the cost of paying the mortgage on a new home sold in the U.S. above the peak of unaffordability achieved during the housing bubble of the early 2000s once again.
For the majority of American new home buyers, rising mortgage rates are making new homes more unaffordable. We already know mortgage rates increased in August 2023, so we anticipate that just ended month will show new homes have become less affordable when its data becomes available.
Image credit: Sears Modern Home No. 165 as it appeared in the 1911 Sears Catalog. Sears Archives - Sears Homes 1908-1914. Public Domain Image.
References
U.S. Census Bureau. New Residential Sales Historical Data. Houses Sold. [Excel Spreadsheet]. Accessed 23 August 2023.
U.S. Census Bureau. New Residential Sales Historical Data. Median and Average Sale Price of Houses Sold. [Excel Spreadsheet]. Accessed 23 August 2023.
Freddie Mac. 30-Year Fixed Rate Mortgages Since 1971. [Online Database]. Accessed 1 September 2023. Note: Starting from December 2022, the estimated monthly mortgage rate is taken as the average of weekly 30-year conventional mortgage rates recorded during the month.
Labels: personal finance, real estate
Welcome to the blogosphere's toolchest! Here, unlike other blogs dedicated to analyzing current events, we create easy-to-use, simple tools to do the math related to them so you can get in on the action too! If you would like to learn more about these tools, or if you would like to contribute ideas to develop for this blog, please e-mail us at:
ironman at politicalcalculations
Thanks in advance!
Closing values for previous trading day.
This site is primarily powered by:
CSS Validation
RSS Site Feed
JavaScript
The tools on this site are built using JavaScript. If you would like to learn more, one of the best free resources on the web is available at W3Schools.com.


