The real estate market for single family homes can be described by two recent headlines that appeared within a day of each other. Can you tell what direction the U.S. home market is going from them?
- US existing home sales slide again, but prices up from a year earlier
- US new home sales rise in July, prices fall on annual basis
What's going on is really a tale of supply, demand, and interest rates. The available supply of existing homes has plummeted while U.S. mortgage rates have risen and demand has remained relatively high. That's a recipe for falling affordability because it results in high home prices and rising mortgage payments.
Existing homeowners, many of which financed their houses at very low mortgage rates in recent years, have become "trapped" in their homes. They are not able to afford either today's higher home sale prices or inflated mortgage payments. And that's only gotten worse with mortgage rates hitting their highest level during the 21st century within the past week. They cannot afford to move and because they cannot, they aren't putting their homes up for sale. That dynamic is what's behind the falling supply of existing homes for sale.
That lack of supply is forcing Americans who are shopping for homes to turn to the new home market to meet their demand. This increased demand has been boosting new home sales at the expense of the shrinking existing home market.
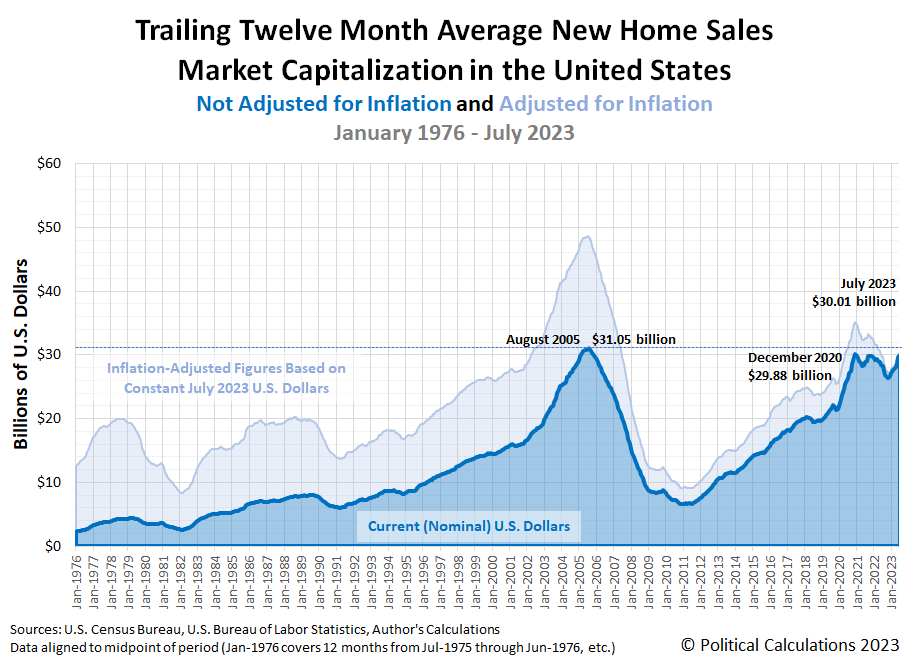
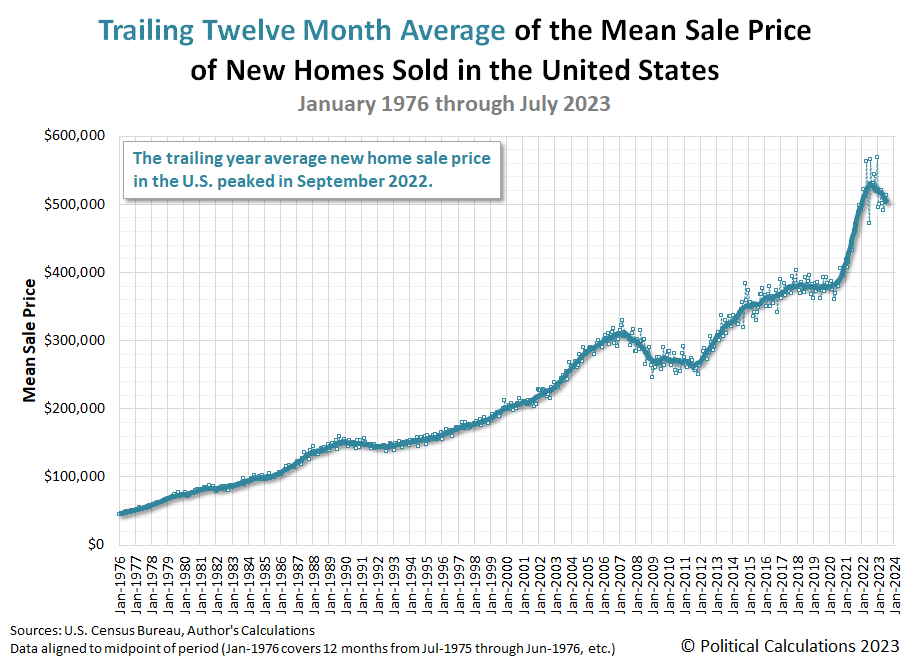
How much it's has been boosting the new home market can be seen in the following charts, which reveal the continuing upward momentum for new home sales in the United States. The initial estimate of the market capitalization of the U.S. new home market during the month is $30.01 billion, up from June 2023's initial estimate of $29.43 billion. New home sales, which have been rising since their trailing twelve month average bottomed in September 2022 to an initial estimate of 674,000. The average sale price of a new home has been falling since September 2022, but remained elevated above the $500,000 mark in July 2023.
Here is the latest update to our chart illustrating the market capitalization of the U.S. new home market:
The next two charts show the latest changes in the trends for new home sales and prices:
For analysis of the existing home market in the U.S., we'll turn to Region Bank's Richard Moody, who notes that part of the U.S. real estate market still hasn't hit bottom:
Existing home sales fell to an annualized rate of 4.070 million units in July from June’s sales rate of 4.160 million units.
Months supply of inventory stands at 3.3 months; the median existing home sale price rose by 1.9 percent year-on-year.
Total existing home sales fell to an annualized rate of 4.070 million units in July, just a bit short of our below-consensus forecast of 4.090 million units. On a not seasonally adjusted basis, there were 372,000 existing homes sold in July, below the 382,000 sales our forecast anticipated. Keep in mind that existing homes are booked at closing, so July closings would mostly reflect sales contracts signed from late-May through June. In other words, the July data on existing home sales reflect some, but by no means all, of the recent run-up in mortgage interest rates, effects that will be felt more fully in the August data. In addition to higher mortgage interest rates, lack of inventory also weighed on July sales, and while this is an old story, literally years old, it has been given a new twist by higher mortgage interest rates making current owners less inclined to trade up into a mortgage interest rate significantly higher than their existing rate. Turnover of the existing housing stock has for years been abnormally low, mainly reflecting demographic shifts, and is now even lower thanks to higher mortgage interest rates. This has helped steer prospective buyers to the market for new homes, but that there is still considerable pent-up demand for home purchases is evidenced by already low times on market being pushed lower while prices are once again being pushed higher, with the median existing home sales price up 1.9 percent year-on-year, ending a run of five straight months of over-the-year declines. At July’s sales rate, inventories of existing homes for sale were equivalent to 3.3 months of sales, far short of the 5.5-to-6.0 months indicative of a balanced market.
CNBC might have stumbled into the best description of the situation facing existing home owners. Rising mortgage rates have created a "golden handcuff effect" for them:
The recent spike in mortgage rates has created a so-called golden handcuff effect. The term is often used to describe financial incentives employers may offer to discourage employees from leaving a company. For homeowners, a low mortgage rate is similar.
Most homeowners today have mortgages with interest rates below 4% or even below 3%, after moving or refinancing when rates hit record lows during the Covid pandemic.
Nearly 82% of home shoppers said they felt “locked-in” by their existing low-rate mortgage, according to a recent survey by Realtor.com.
Because of that, there is a critical shortage of homes for sale, with year-to-date new listings roughly 20% behind last year’s pace.
At least we're not the only ones seeing it.
References
U.S. Census Bureau. New Residential Sales Historical Data. Houses Sold. [Excel Spreadsheet]. Accessed 23 August 2023.
U.S. Census Bureau. New Residential Sales Historical Data. Median and Average Sale Price of Houses Sold. [Excel Spreadsheet]. Accessed 23 August 2023.
Image credit: Photo by Avi Waxman on Unsplash.
Labels: real estate
Welcome to the blogosphere's toolchest! Here, unlike other blogs dedicated to analyzing current events, we create easy-to-use, simple tools to do the math related to them so you can get in on the action too! If you would like to learn more about these tools, or if you would like to contribute ideas to develop for this blog, please e-mail us at:
ironman at politicalcalculations
Thanks in advance!
Closing values for previous trading day.
This site is primarily powered by:
CSS Validation
RSS Site Feed
JavaScript
The tools on this site are built using JavaScript. If you would like to learn more, one of the best free resources on the web is available at W3Schools.com.


