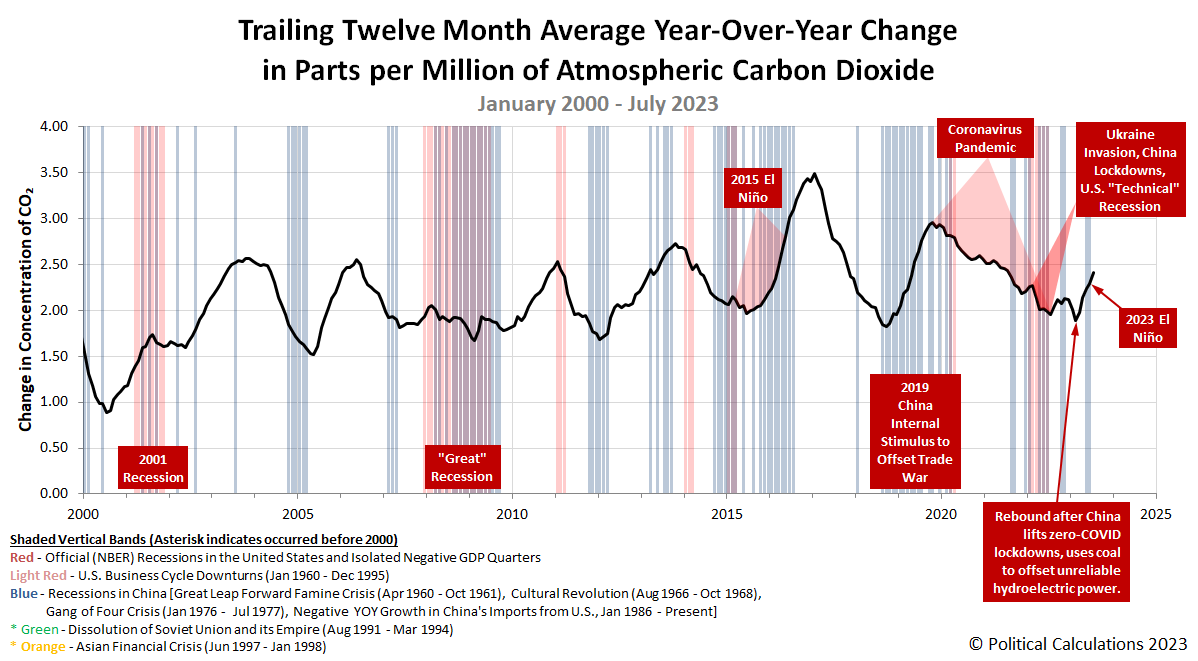
July 2023 saw the pace of accumulation of carbon dioxide in the Earth's atmosphere increase again, continuing a trend that began after China's government lifted its zero-COVID lockdowns at the end of 2022.
Normally, the lifting of such repressive conditions would be a boost for the country's economy, which would be expected to be accompanied by increased CO₂ emissions. China is, by a very wide margin, the world's biggest emitter of carbon dioxide into the air.
In the first quarter of 2023, that's what it looked like, but since that initial rebound, China's economy has been reported to be either "sputtering" or "faltering" depending on whichever thesaurus the reporters have been using.
And yet, the rate at which the carbon dioxide is being emitted into the atmosphere has continued to rise rapidly. That increase should be a sign of increased economic activity, particularly in China. But with China's economy having trouble gaining traction, that's a good indication something else is going on. Here's the latest update to our chart tracking the rate of change of atmospheric CO₂ levels in the 21st century that shows the rising trend:
We recently got a good indication of what that something else might be from Reuters, which reports that the Chinese government has ramped up its burning of coal to generate power because the country's hydropower has been largely taken offline because of sustained drought.
China has leant hard on coal-fired power plants as well as wind and solar generators to make up for a shortfall in hydroelectric generation as a result of low rainfall across the south since the middle of 2022.
China’s generation increased by +173 billion kilowatt-hours (+5.3%) in the first five months of the year compared with the same period in 2022, data from the National Bureau of Statistics (NBS) showed.
Big increases from mostly coal-fired thermal generators (+149 billion kWh), wind farms (+79 billion kWh) and solar generators (+19 billion kWh) offset a fall in hydro production (-82 billion kWh).
The net increase represents China's efforts to stimuluate its sputtering economy, above and beyond what it is taking to compensate for the unreliability of its hydroelectric power generating facilities in the face of drought.
There's more going on in the world adding to atmospheric CO₂. Canada's wildfires are estimated to have added 290 megatons of extra carbon dioxide to the Earth's air in 2023, which is the equivalent of about half of Canada's annual carbon dioxide emissions in a recent years. By comparison, China'a annual CO₂ output is about 20 times larger, so even with Canada's wildfires, China is still dominating global carbon dioxide emissions.
And then there's a new El Niño event, which was just officially declared in June 2023. El Niño events are associated with spikes in carbon dioxide emissions, largely because of their associated changes in weather patterns. In both 1998 and 2015, those changes contributed to exceptionally large wildfires in Indonesia, which greatly added to atmospheric carbon dioxide levels.
Canada's wildfires pre-date the new El Niño event, so its potential impact is still yet to be felt.
Together, these factors produce the result of the pace of global CO₂ emissions increasing, which is not being matched by a similar rate of growth in the global economy.
References
National Oceanographic and Atmospheric Administration. Earth System Research Laboratory. Mauna Loa Observatory CO2 Data. [Text File]. Updated 5 August 2023.
Image credit: Smoke in a Valley during Fire Season British Columbia photo by Landon Parenteau on Unsplash.
Labels: economics, environment
Welcome to the blogosphere's toolchest! Here, unlike other blogs dedicated to analyzing current events, we create easy-to-use, simple tools to do the math related to them so you can get in on the action too! If you would like to learn more about these tools, or if you would like to contribute ideas to develop for this blog, please e-mail us at:
ironman at politicalcalculations
Thanks in advance!
Closing values for previous trading day.
This site is primarily powered by:
CSS Validation
RSS Site Feed
JavaScript
The tools on this site are built using JavaScript. If you would like to learn more, one of the best free resources on the web is available at W3Schools.com.

