to your HTML Add class="sortable" to any table you'd like to make sortable Click on the headers to sort Thanks to many, many people for contributions and suggestions. Licenced as X11: http://www.kryogenix.org/code/browser/licence.html This basically means: do what you want with it. */ var stIsIE = /*@cc_on!@*/false; sorttable = { init: function() { // quit if this function has already been called if (arguments.callee.done) return; // flag this function so we don't do the same thing twice arguments.callee.done = true; // kill the timer if (_timer) clearInterval(_timer); if (!document.createElement || !document.getElementsByTagName) return; sorttable.DATE_RE = /^(\d\d?)[\/\.-](\d\d?)[\/\.-]((\d\d)?\d\d)$/; forEach(document.getElementsByTagName('table'), function(table) { if (table.className.search(/\bsortable\b/) != -1) { sorttable.makeSortable(table); } }); }, makeSortable: function(table) { if (table.getElementsByTagName('thead').length == 0) { // table doesn't have a tHead. Since it should have, create one and // put the first table row in it. the = document.createElement('thead'); the.appendChild(table.rows[0]); table.insertBefore(the,table.firstChild); } // Safari doesn't support table.tHead, sigh if (table.tHead == null) table.tHead = table.getElementsByTagName('thead')[0]; if (table.tHead.rows.length != 1) return; // can't cope with two header rows // Sorttable v1 put rows with a class of "sortbottom" at the bottom (as // "total" rows, for example). This is B&R, since what you're supposed // to do is put them in a tfoot. So, if there are sortbottom rows, // for backwards compatibility, move them to tfoot (creating it if needed). sortbottomrows = []; for (var i=0; i
Previously, Political Calculations created a tool that allows the user to determine the odds of a recession occurring in the next 4 quarters given only the Federal Funds Rate and the spread between the 3-Month and 10-Year U.S. Treasury notes. The tool is built upon the work done by Jonathan Wright of the Federal Reserve Board, whose "Model B" appears to best predict future recessions. (Wright's paper is available as a 158KB PDF document.)
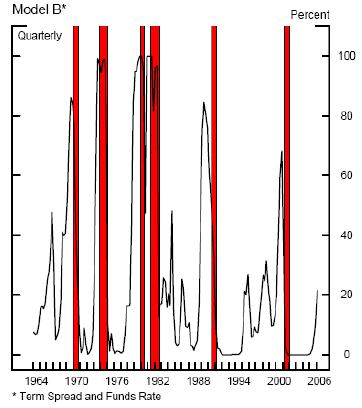
In reviewing the paper, I couldn't help noticing that the 50% probability level seemed to be a key cut-off in determining if there would or would not be a recession in the next twelve months. Basically, over the last 41 years, a recession followed if the 50% probability threshold for Wright's Model B was exceeded, while no recession occurred if this threshold was not exceeded. The following chart, taken from Wright's paper, illustrates this observation by showing the probability of recession measured between 1964 and the end of 2005, and when recessions were officially determined to begin and end:
We here at Political Calculations are always on the look-out for things we can turn into useful tools. So, when we saw this pattern, we recognized that we could create a visual representation of how close the U.S. is to a recession at any given time by determining what spread between the 3-Month and 10-Year Treasury notes that it would take for a given Federal Funds Rate to reach the apparently critical 50% probability level of a recession, and comparing it to the current bond yield spread.
Using our recession odds tool, we reverse-engineered the bond spread needed to produce a 50% probability of recession given various Federal Funds Rates. We found that a linear relationship exists between the bond spread and Federal Funds Rate, which is illustrated in the chart below:
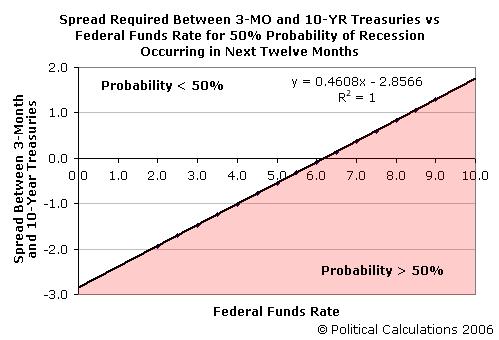
In the chart above, note that all points that fall in the area below the horizontal axis represents the "inverted yield curve" condition that gets Wall Street analysts' collective panties in a bunch! We also find in the chart that the 50% probability threshold may even occur when the spread between the 3-Month and 10-Year Treasuries is flat (equal to zero) or even positive for Federal Funds Rates equal to or greater than 6.200%!
Because this is Political Calculations after all, we've built the following simple tool to determine the bond yield spread needed for the Federal Funds Rate you enter for the U.S. economy to have a 50% chance of recession in the next 12 months:
Now, all you need to do is determine if the current spread between the 3-Month and 10-Year Treasuries is higher or lower than the given value to see how concerned you should be about a looming recession in the future! Cool, huh?
Update: We might be guilty of false advertising if we didn't, in fact, include a visualization of the likelyhood of recession! The following illustration tracks the Fed's latest tightening cycle and shows the spread between the 3-Month and 10-Year Treasuries on the date the Fed adjusted the Federal Funds Rate to the indicated level:
We'll also note that the probability of recession since January 31, 2006 (covering the three most recent Federal Funds Rate increases) has been stable around 26-27%.
Update 2: Welcome Econbrowser readers!
Labels: recession forecast, tool
Welcome to the blogosphere's toolchest! Here, unlike other blogs dedicated to analyzing current events, we create easy-to-use, simple tools to do the math related to them so you can get in on the action too! If you would like to learn more about these tools, or if you would like to contribute ideas to develop for this blog, please e-mail us at:
This year, we'll be experimenting with a number of apps to bring more of a current events focus to Political Calculations - we're test driving the app(s) below!
The S&P 500 at Your Fingertips
The Distribution of Income for 2010: Individuals
Should You Trade in Your Gas Guzzler?
What Are the Chances Your Marriage Will Last?
Tipping Around the World
What's Your Body Fat Percentage?
The Odds of Dying, Again!
Gas Prices, the Unemployment Rate, and Desperation
Hauser's Law
The Real Story Behind "Rising" U.S. Income Inequality
First Time Visitor to Political Calculations?
On the Moneyed Midways
A Lot, But Not All, of Our Tools
Political Calculations' U.S. GDP Temperature Gauge provides a means to quickly evaluate the growth rate of the U.S. economy against the backdrop of how the economy has performed since 1980, with the "temperature" color spectrum ranging from a recessionary "cold" (purple) through an expansionary "hot" (red).
The GDP Temperature Gauge presents both the annualized GDP growth rate as reported by the U.S. Bureau of Economic Analysis reports for a one-quarter period and also as averaged over a two quarter period, which smooths out the volatility seen in the one-quarter data and provides a better indication of the relative strength of the U.S. economy over time.
This site is primarily powered by:
Visitors since December 6, 2004:
The tools on this site are built using JavaScript. If you would like to learn more, one of the best free resources on the web is available at W3Schools.com.
ZunZun - Exceptional regression analysis tool.
Wolfram Integrator - Solve integrals. Do calculus!
Create a Graph - Easy-to-use basic graph-making tool.
Many Eyes - Data visualization extraordinaire!
Wolfram Alpha - Computational knowledge engine.
Khan Academy - Math & science video mini-lectures!
Picasion - Animate images.
Bloodhoundblog
Budgets Are Sexy
Cafe Hayek
Carpe Diem
Core77
Coyote Blog
Craig Harper
Darwin's Finance
Digerati Life, The
Division of Labour
Dough Roller, The
Eclectecon
Econlog
Economics Roundtable
EconomicsUK
Environmental Economics
Escape from Cubicle Nation
Execupundit
FiscalGeek
Get Rich Slowly
Gongol
Good Financial Cents
HR Bartender
Hot Air
i4cp Productivity
Innocent Bystanders
Innovation and Growth
Instapundit
Intangible Economy
I've Paid Twice for This Already
Joanne Jacobs
Kaus Files
Len Penzo dot Com
Making Ripples
Market Power
Mechonomics
Mighty Bargain Hunter
Monevator
My Dollar Plan
New Economist
Newmark's Door
Nina Simosko
Physorg
Private Sector Development
Real Clear Politics
Richard Fernandez
Roger L. Simon
Rowan Manahan
Sound Politics
SOX First
Sports Economist, The
squawkfox
Three Star Leadership
Tim Worstall
Townhall
Trusted Advisor
Uncommon Misperceptions
voluntaryXchange
WILLisms
Winterspeak
Big Picture, The
Crackerjack Finance
CXO Advisory Group
Disciplined Approach to Investing
Dividend Guy, The
Doug Short
Evidence Investing
Fat Pitch Financials
FX Investment Strategies
Oilprice
American Red Cross
Children's Heart Foundation
Salvation Army
SMA Foundation
Kindle Paperwhite 3G - Best e-reader!
Angel in the Whirlwind
Bailout Nation
Cartoon Guide to Statistics
A Comprehensive Guide to the Peloponnesian War
The Complete Personal Memoirs of Ulysses S. Grant
The Count of Monte Cristo
Ender's Game
Gardner's Art Through the Ages
Empire of Wealth
How to Make Presentations to Councils and Boards
Juran's Quality Handbook
Marks' Standard Handbook
The Second World War
Stocks for the Long Run
Why Smart Executives Fail
The Tudors: The Complete Series
Kindle Fire HD 8.9" 4G LTE Wireless 32 GB
Snap Circuits Jr. SC-100
Nerf Vortex Praxis
Sony BRAVIA 40" LED HDTV
2540 Series Docking Station
New Balance MX623
Dunham Men's Waterproof Oxford
TN360 Black Toner Cartridge
The Dangerous Book for Boys
Air Swimmer Remote Control Inflatable Flying Shark
Fisher-Price Little People Lil Pirate Ship