Earlier this week, the New York Times announced that it would be shrinking the size of its pages to save money. Oh, and its staff too. Again.
Here's a quick timeline of New York Times recent history of staff reductions:
- January 2001
- New York Times announces that it will cut 69 jobs of its Internet staff (at the time, 17% of its Internet workforce.)
- April 2001
- New York Times announces will begin across-the-board layoffs. Job cuts include 100 employees from its regional newspaper group.
- May 2005
- New York Times annouces staff reductions of 190 employees (less than 2% of workforce).
- September 2005
- New York Times announces layoffs of 500 employees (4% of workforce.)
- July 2006
- New York Times announces will shrink newspaper (newsprint), news (5%) and employee headcount by 250 (2%).
By our count, we find that the New York Times has laid off some 1109 employees in the six years since the beginning of the century, a little over 8% of the total number of its employees in 2000.
The Real Question
Of course, the real question has nothing to do with how many hard-working people the New York Times will slash from its payroll. Oh, no. The real question is: How will the same business conditions that have led to the ongoing shrinkage (in workforce, and now literally) of the New York Times affect publisher Arthur "Pinch" Sulzberger's annual bonus?
What makes this question relevant is how the New York Times' Board of Directors acted just last year, as the Times' management team, led by Sulzberger, moved to reduce its staff by 500 people as a permanent cost savings measure. Despite the newspaper's stagnant business condition, which apparently required the ouster of 4% of its staff, they awarded him a substantial bonus of $560,521 in cash and granted him restricted stock units worth $817,500 - on top of his $1,055,596 annual salary for a grand total of $2,433,617 in total financial compensation.
But, let's put the situation at the New York Times differently - we'll compare the newspaper's business condition (represented by its stock price) with Sulzberger's compensation in the chart below:
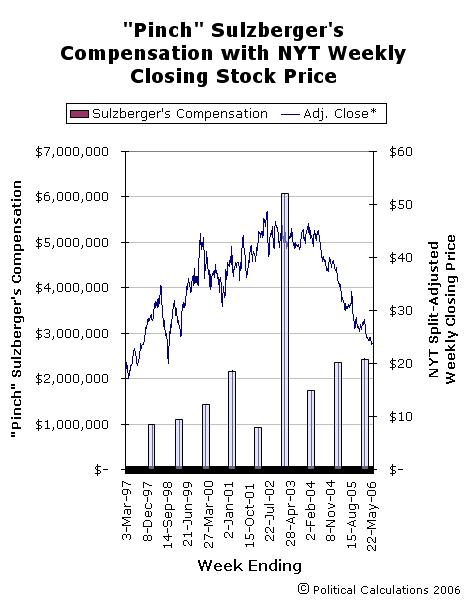
Is Pinch in for a pay cut this year? Draw your own conclusions, but consider the following two questions and answers....
Why was Pinch's pay so low in 2001? We've listed Sulzberger's compensation in the chart above as occurring when the New York Times annual report for the previous year's business was released - in this case, in March 2001. Here, Pinch's low pay level is the result of the New York Times' falling advertising revenues throughout 2000, which led, in good part, to the paper's layoffs later in 2001. Sulzberger did not receive a bonus for that year, which accounts for its "low" level compared to other years.
Why did Pinch get such a huge spike in compensation in 2002? It might have something to do with what the New York Times called the largest circulation gains it experienced in over 10 years, which also coincided with the papers Pulitzer-prize winning coverage of the terrorist attacks on the U.S. on September 11, 2001 (it won seven Pulitzers - its most ever in a single year.)
The paper's performance since then, reflected in its recently announced cost reduction measures, suggests that Sulzberger's compensation in 2002 was grossly excessive as the New York Times has moved away from the balanced coverage of stories of both great national and local interest.
Because of that factor, it's difficult to see a responsible board of directors approving any bonus for the newspaper's management team in the upcoming year. It may all be a moot point however since Sulzberger's family controls the company's board and can set whatever minimal and arbitrary performance requirements it desires in setting its compensation policies for executive bonuses.
Previously on Political Calculations
Welcome to the blogosphere's toolchest! Here, unlike other blogs dedicated to analyzing current events, we create easy-to-use, simple tools to do the math related to them so you can get in on the action too! If you would like to learn more about these tools, or if you would like to contribute ideas to develop for this blog, please e-mail us at:
ironman at politicalcalculations
Thanks in advance!
Closing values for previous trading day.
This site is primarily powered by:
CSS Validation

RSS Site Feed
JavaScript
The tools on this site are built using JavaScript. If you would like to learn more, one of the best free resources on the web is available at W3Schools.com.
Other Cool Resources
Blog Roll


