Not long ago, one of our readers pointed our attention to a recent paper from the San Francisco branch of the Federal Reserve by Glenn D. Rudebusch and John C. Williams, who found that the U.S. Treasury yield curve was, by far, a better predictor of recessions in the U.S. than professional economic forecasters.
Since the recent volatility in the markets combined with the extreme doom and gloom of several of these professional economic forecasters has sparked some additional interest in whether or not the U.S. economy will go into recession anytime soon, it seemed to be a good time to revisit our tools for forecasting recessions, which are based on a model developed by the Federal Reserve's Jonathan Wright, and which combine U.S. Treasury yield curve data with the level of the Federal Funds Rate set by the Fed, and develop a new ongoing feature here at Political Calculations.
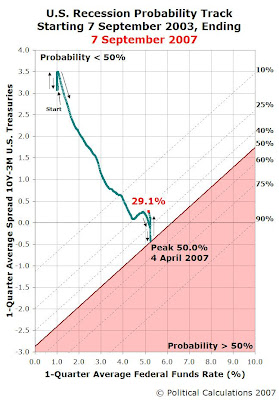
Over the weekend, we unveiled that new ongoing feature! The Recession Probability Track will be updated weekly and will appear in the right hand margin of the site. The first chart covers the period from 8 September 2003 through last Friday, 7 September 2007:

The chart highlights the most recent 12-month recession probability peak of 50.0% that was reached on 4 April 2007. Since then, the probability that the U.S. will be in recession has receded to a value of 29.0% on last Friday, 7 September 2007.
For the sake of historical context, the following chart illustrates the track the probability of recession took in the four years prior to the current four year-long chart, spanning from 7 September 1999 through 5 September 2003:

This chart gives an indication of the predictive power of the recession prediction model developed by Jonathan Wright, who developed the math behind our recession predicting tool. Here, we see that the probability of recession occurring in the next 12 months first exceeded the 50% level on 9 August 2000, before peaking at a level of 71.8% on 3 January 2001, and dropping back below the 50% level on 13 March 2001.
The National Bureau of Economic Research determined the corresponding recession began in March 2001 (7 months after Wright's method forecast) and ended in November 2001 (8 months after Wright's method dropped below the 50% probability level).
Labels: recession forecast
Welcome to the blogosphere's toolchest! Here, unlike other blogs dedicated to analyzing current events, we create easy-to-use, simple tools to do the math related to them so you can get in on the action too! If you would like to learn more about these tools, or if you would like to contribute ideas to develop for this blog, please e-mail us at:
ironman at politicalcalculations
Thanks in advance!
Closing values for previous trading day.
This site is primarily powered by:
CSS Validation
RSS Site Feed
JavaScript
The tools on this site are built using JavaScript. If you would like to learn more, one of the best free resources on the web is available at W3Schools.com.