"Wrong, but useful." Those are the words we're putting to use today as we apply the kind of statistical analysis that applies to normal (aka "bell-curve shaped") distributions to the relationship between the value of the S&P 500 and dividends per share to divine where the stock market may be heading.
Our analytical technique is wrong, as the relationship between stock prices and their underlying dividends per share do not hold to a true normal distribution. That's especially true in the long term, such as over decades, but not as clear in shorter periods of time, say over months and years. Using conventional statistical analysis techniques may be useful over these shorter periods of months and years, as they may provide a means of extracting useful bits of information about the health of the stock market from the movement of stock prices.
In previously looking at the orderly relationship between the S&P 500's average monthly index value and its trailing year dividends per share between June 2003 and January 2008, we observed that the final breakdown of that order in January 2008 was preceded by two separate downward shifts of roughly two standard deviations in magnitude, the first occurring from July 2007 to August 2007 and the second occurring from October 2007 to November 2007.
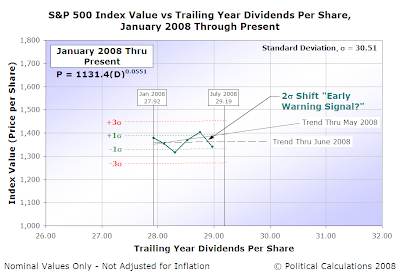
We speculated that such two standard deviation downward shifts "may be a useful indicator for anticipating when order may be beginning to break down in the stock market." Of course, we're bringing this all up for a reason, so let's take a look at 2008 from January through the end of June:

And there it is. In the month of June, the S&P 500 dove by a potentially ominous two standard deviation downward shift, perhaps signaling perilous times ahead for stock market investors.
In our understanding of the stock market, such a decline represents the increased likelihood that dividends of a number of S&P 500 companies are about to be significantly reduced. By deflating stock prices by this amount, thousands and thousands of investors are signaling that they expect this action will occur. So the question for a current investor in the market is: are they right?
Here's a quick summary of the evidence that suggests the market is going to dig out new lows before significantly changing track, or more specifically, the news and rumors that have recently been driving investor expectations:
- In June 2008, three major financial institutions acted to reduce their dividends, driven by the fallout from the collapse of the subprime lending-driven portion of the housing market, Fifth Third, Fortis and Frontier Bank. While a number of other companies increased their dividend payouts in June 2008, the magnitude of the cuts outweighed the gains generated by the more financially healthy companies.
- A number of other financial institutions are likely to take action to reduce their dividend payouts to investors as early as July 2008. These companies include Bank of America, Fidelity Southern, Merrill Lynch, SunTrust, Wachovia and perhaps most notably, Citigroup, which had previously cut its dividend in January.
- Most importantly, the Federal Reserve is pressuring banks to cut their dividends to better weather their current economic conditions. Reducing dividends paid out to investors would strenthen the balance sheets of many of these distressed banks by increasing the amount of capital they have available.
Update: We should note that since the link above was first published, SunTrust Banks has stated that they will not be cutting their dividend nor issuing new shares to raise capital.
Meanwhile, outside of the troubled banking market, and the high-gas-price distressed automotive and aviation-related companies, the stock market appears surprising strong. Consequently, we would anticipate that the market will shift to a "lower energy state," much as it appears to have done back in January. Here, as we saw from July through December 2007, even though investors had similar expectations, the bottom didn't drop out of the previous order in the stock market until a number of major companies actively started slashing their dividends.
Why that would seem to be the case is pretty fascinating. We'll have to visit that topic sometime in the future!
Labels: dividends, SP 500, stock market
Welcome to the blogosphere's toolchest! Here, unlike other blogs dedicated to analyzing current events, we create easy-to-use, simple tools to do the math related to them so you can get in on the action too! If you would like to learn more about these tools, or if you would like to contribute ideas to develop for this blog, please e-mail us at:
ironman at politicalcalculations
Thanks in advance!
Closing values for previous trading day.
This site is primarily powered by:
CSS Validation
RSS Site Feed
JavaScript
The tools on this site are built using JavaScript. If you would like to learn more, one of the best free resources on the web is available at W3Schools.com.