Question: Where are stock prices headed?
But our real question is: "How much lower?"
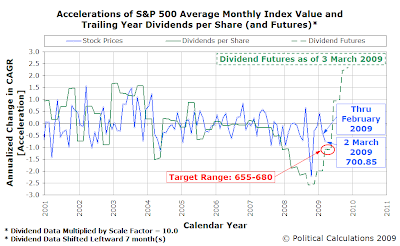
Using our chart showing the time-shifted acceleration rates of both stock prices and dividends per share, we may be able to anticipate where stock prices will be headed based upon the latest information we have about the expected future values for dividends per share for the S&P 500:

We find our target range of 655 to 680 by asking what the average value of the S&P 500 would have to be to decline to the level indicated by the latest dividend futures data, given the typical range of our dividend amplification factor that we've observed since 2001. We've previously shown that the acceleration rate of stock prices is the product of this amplification factor and the acceleration rate of expected dividends per share.
Meanwhile, we were amused by this quote from Reuters' article Wall St Mostly Inches Up After Obama's Comments:
U.S. stocks mostly edged higher on Tuesday after President Barack Obama said share prices are potentially a good deal at current levels, offsetting persistent uncertainty about plans to shore up the financial system.
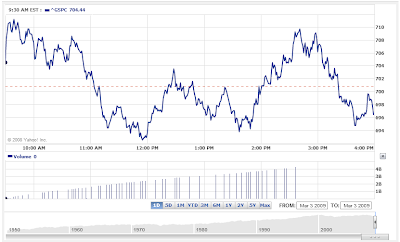
Once again, this is further evidence of our contention that Barack Obama is just not a very smart man when it comes to money. Speaking of the effects of his comments upon the stock market:

Based on this chart, we suspect that someone at Reuters has a very unique definition of the word "Up".
Labels: chaos, SP 500, stock market
Welcome to the blogosphere's toolchest! Here, unlike other blogs dedicated to analyzing current events, we create easy-to-use, simple tools to do the math related to them so you can get in on the action too! If you would like to learn more about these tools, or if you would like to contribute ideas to develop for this blog, please e-mail us at:
ironman at politicalcalculations
Thanks in advance!
Closing values for previous trading day.
This site is primarily powered by:
CSS Validation
RSS Site Feed
JavaScript
The tools on this site are built using JavaScript. If you would like to learn more, one of the best free resources on the web is available at W3Schools.com.
