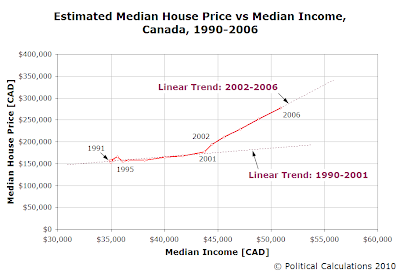
Right now, there's a growing concern in Canada that the real estate market may have entered into an unsustainable bubble for house prices. We have the analysis tools to be able to answer the question of whether or not that's true.
But we can't. And we can't because we aren't able to find reliable data for both median house prices and median total incomes in Canada past 2006. (Note: We applied the recorded index of Canadian house prices to incomes to estimate the Canadian median house prices for the years from 1990 through 2006 to create the chart showing the relationship between these two measures.)

That shift suggests a sustained change affecting the Canadian real estate market took place in either 2001 or early in 2002, which resulted in house prices growing at a faster rate since. That faster rate of housing price growth is clearly supported by a strong correlation with income growth, which means no bubble formed in the Canadian national housing market during this time.
By our operational definition, for an economic bubble to exist, the price of an asset that may be freely exchanged in a well-established market (houses in this case) first soars then plummets over a sustained period of time at rates that are decoupled from the rate of growth of the income that might be realized from owning or holding the asset. For housing, that income is called rent.
However, we've since found that what people pay in rent, or housing in general, is itself a strong function of income. That observation is confirmed by a 2008 paper by Quan Gan and Robert J. Hill, who found that a strong linear relationship exists between house prices and income percentiles for housing markets Sydney, Australia, Dallas, Texas and the state of Texas.
Our analytical method looks at how the intersection of median house prices with respect to median incomes, changes over time, which we've found follows a linear trend itself except when a bubble has formed in the housing market, such as in the United States and in England during the 2000s.
The advantage to our analytical method for detecting housing bubbles is that we can quickly identify when housing prices decouple from the income that can sustainably support them.
So, if someone in Canada is really concerned about whether a bubble has formed in the nation's real estate markets since 2006, send us the data for national median house prices and median total income for 2007, 2008 and 2009. We'll tell you for free!
Labels: economics, real estate
Welcome to the blogosphere's toolchest! Here, unlike other blogs dedicated to analyzing current events, we create easy-to-use, simple tools to do the math related to them so you can get in on the action too! If you would like to learn more about these tools, or if you would like to contribute ideas to develop for this blog, please e-mail us at:
ironman at politicalcalculations
Thanks in advance!
Closing values for previous trading day.
This site is primarily powered by:
CSS Validation
RSS Site Feed
JavaScript
The tools on this site are built using JavaScript. If you would like to learn more, one of the best free resources on the web is available at W3Schools.com.