In his 2012 State of the Union Address, President Obama sought to "embrace manufacturing". Since the President has been in office for three years now, we thought we would take a look at how well he's done so far in embracing manufacturing, by his own terms.
Our first chart shows the seasonally-adjusted number of individuals employed in the Manufacturing and the closely-related Transportation and Warehousing industries (aka "the supply chain"), which is based upon data collected by the Bureau of Labor Statistics in its Current Employer Survey, as of 22 January 2012, from November 2007 through December 2011.

In the chart above, we've emphasized several points with bold text indicating the number of employed at various points of interest. These points correspond to the month preceding the start of the "Great Recession", the month President Obama was sworn into office, the bottom of job loss for the recession, and the most recent month for which we have data, December 2011.
Here, we find that the number of individuals counted as being employed in the manufacturing and supply chain industries has fallen considerably from November 2007 through the present, with 1,583,000 fewer being employed in Manufacturing and 1,964,000 fewer being employed in Transportation and Warehousing as of December 2011. Together, these two sectors of the U.S. economy represent almost 3 out of 5 of all the jobs that have disappeared from the U.S. economy since November 2007.
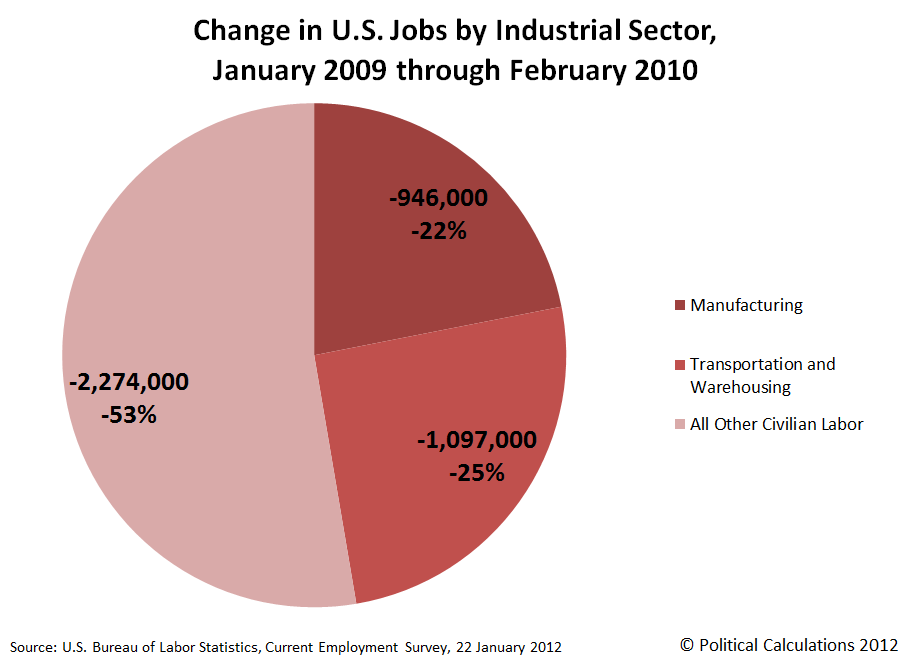 Starting the clock from January 2009, we find that 946,000 jobs in manufacturing evaporated before job losses in the economy finally bottomed in February 2010, eight months after the recession officially ended, while the number of individuals employed in the transportation and warehousing industries fell by 1,097,000. Combining these figures, we find that these two sectors of the U.S. economy account for over 47% of the 4,317,000 total jobs that were lost according to the BLS' data during the first 13 months of President Obama's tenure.
Since job losses in U.S. manufacturing and supply chain-related industries bottomed in February 2010, some 617,000 jobs in manufacturing and 328,000 in transportation and warehousing have been added to the U.S. economy. These two sectors account for 35.6%, or a just over 1 out of 3 of the 2,654,000 total jobs that have been added to the U.S. economy since February 2010.
 Going by the post-recovery figures, we find that President Obama hasn't been paying much attention to manufacturing, either during the recession or during the recovery, as its share of jobs lost and created has been essentially identical during his three years in office.
If anything, it appears that the President's focus on "creating" jobs has been in any area outside of manufacturing or supply chain-related industries, as these areas have seen a disproportionate gain compared to jobs lost during the President's first three years in office.
But perhaps the bigger story is the extent to which President Obama hasn't been paying attention to boosting jobs in the Transportation and Warehousing sector of the U.S. economy. This is the unglamorous industry that ties together all U.S. manufacturers, from the most upstream makers of parts that go into other products all the way through the final link in the chain that reaches the final consumer, moving and storing manufactured goods as value is added through each stage of manufacturing production.
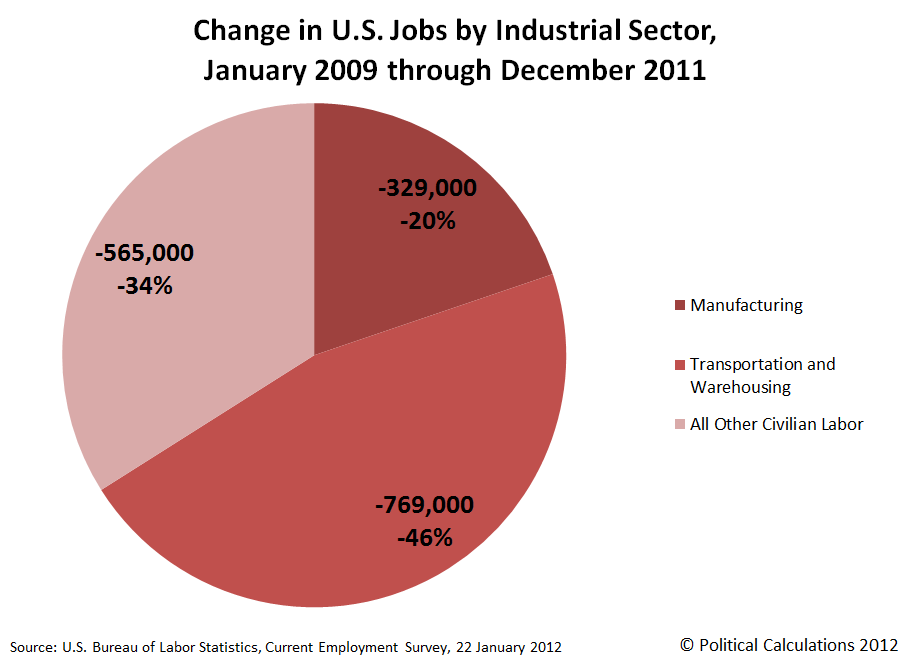
We'll close by sharing our final chart, spanning all the time the President has been in office at this writing, showing the net change in jobs by industrial sector from January 2009 through December 2011:
Perhaps the President should have "pivoted to jobs" more often in the first three years of his Presidency. Especially those unglamorous ones that don't make for good photo ops, as his agenda today suggests is his real focus....
Labels: jobs
Welcome to the blogosphere's toolchest! Here, unlike other blogs dedicated to analyzing current events, we create easy-to-use, simple tools to do the math related to them so you can get in on the action too! If you would like to learn more about these tools, or if you would like to contribute ideas to develop for this blog, please e-mail us at:
ironman at politicalcalculations
Thanks in advance!
Closing values for previous trading day.
This site is primarily powered by:
CSS Validation

RSS Site Feed
JavaScript
The tools on this site are built using JavaScript. If you would like to learn more, one of the best free resources on the web is available at W3Schools.com.
Other Cool Resources
Blog Roll


