Political Calculations
April 24, 2012

Those who follow our analysis on a regular basis already know that we consider the number of seasonally-adjusted initial unemployment insurance claims filed each week to be the most easy-to-accurately-predict number in all of economic datadom.

Western Electric Rules for Detecting Breaks in Established Trends Using Statistical Control Charts The reason why is because the weekly data tends to follow a straight-line path over time, with the variation in the data from week-to-week about these linear trends being easily described by a normal, bell-curve kind of statistical distribution.

Periodically, breaks in existing trends occur and new trends begin, which we are able to identify using the kind of statistical analysis that has been successfully and widely applied in manufacturing or industrial applications for over 80 years.

Here, we recognize that the cause of a break in an existing trend in the weekly jobless claims data is actually triggered by events that significantly altered the business outlook for employers some 2-3 weeks earlier in time, which corresponds to the employers implementing their decisions affecting their employee retention plans with their next pay cycle. Since most employed Americans are paid on either a weekly or biweekly basis, that works out to a two-to-three week lag from when an event significantly affecting the pace of layoffs in the U.S. occurs, to when the effects of such a change in the business outlook of employers shows up in the BLS' weekly data reports.

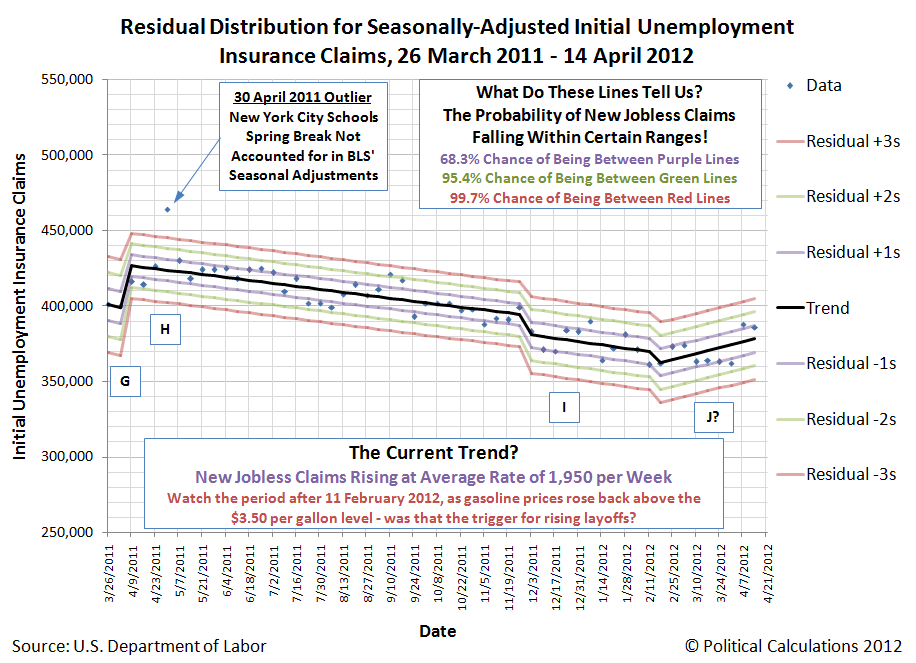
With that in mind, we're going to present two possible hypotheses behind what's affecting the level of claims filed for new unemployment benefits that are being filed today. Here, we begin with what we describe as the "current" trend, which we've previously identified began on 3 December 2011, as the average price for gasoline in the United States fell below $3.50 per gallon two-to-three weeks earlier. In our first chart, we assume that trend is still in effect:

Hypothesis One: Residual Distribution of Seasonally-Adjusted Initial Unemployment Insurance Claims Filed Weekly from 26 March 2011 through 14 April 2012

Here, our first hypothesis of what's behind the changes we're now observing for new jobless claims is that that previous improvement we've seen in the number of new claims filed for recently laid off employees is in the process of flattening out at a level somewhere between 370,000 and 380,000 claims each week. We note that level of new jobless claims is some 60,000-70,000 higher than the average level that was typical in the years preceding the December 2007 recession and would be consistent with a permanently higher unemployment rate than the 4.7% that was recorded in the U.S. during that time.

For our second chart, our hypothesis is that the increase in the national average of gasoline prices in the United States back above the $3.50 per gallon mark in the final week of January 2012, the effects of which would show up in the weekly data after 11 February 2012, has perhaps initiated a new, but increasing trend in the number of new jobless claims being filed each week:

Hypothesis Two: Residual Distribution of Seasonally-Adjusted Initial Unemployment Insurance Claims Filed Weekly from 26 March 2011 through 14 April 2012

And that's where we are today in our thinking. We should know sometime this summer (and hopefully sooner) which of our two hypotheses has turned out to be true, or if another hypothesis might perhaps better describe what is happening with the number of new jobless benefit claims being filed each week.

Labels: ,


<< Home
Unexpectedly Intriguing!

About Political Calculations


blog advertising
is good for you

Welcome to the blogosphere's toolchest! Here, unlike other blogs dedicated to analyzing current events, we create easy-to-use, simple tools to do the math related to them so you can get in on the action too! If you would like to learn more about these tools, or if you would like to contribute ideas to develop for this blog, please e-mail us at:

ironman at politicalcalculations.com

Thanks in advance!

Recent Posts

The Doubling Rates of U.S.-China Trade Since Janua...

What's Hot and What's Not for Jobs in 2012

How Much Does President Obama Still Owe on His Hou...

GE CEO Stuck Inside Wet Paper Bag

The New and Improved MyTaxBurden.com

2012 Tax Day Fun: File Your 1913 Income Taxes

2012: How Many Pages Are There In the U.S. Tax Cod...

How High Will the Top Income Tax Rate Go?

Redesign Your Own Flat Income Tax!

Should You Donate to Charity for the Tax Deduction...

Elsewhere on the Web

This year, we'll be experimenting with a number of apps to bring more of a current events focus to Political Calculations - we're test driving the app(s) below!

Most Popular Posts

The S&P 500 at Your Fingertips

The Distribution of Income for 2010: Individuals

Should You Trade in Your Gas Guzzler?

What Are the Chances Your Marriage Will Last?

Tipping Around the World

What's Your Body Fat Percentage?

The Odds of Dying, Again!

Gas Prices, the Unemployment Rate, and Desperation

Hauser's Law

The Real Story Behind "Rising" U.S. Income Inequality

Quick Index

First Time Visitor to Political Calculations?

On the Moneyed Midways

A Lot, But Not All, of Our Tools

U.S. GDP Temperature Gauge

Political Calculations' GDP Temperature Gauge, 2013Q1 First Estimate Political Calculations' U.S. GDP Temperature Gauge provides a means to quickly evaluate the growth rate of the U.S. economy against the backdrop of how the economy has performed since 1980, with the "temperature" color spectrum ranging from a recessionary "cold" (purple) through an expansionary "hot" (red).

The GDP Temperature Gauge presents both the annualized GDP growth rate as reported by the U.S. Bureau of Economic Analysis reports for a one-quarter period and also as averaged over a two quarter period, which smooths out the volatility seen in the one-quarter data and provides a better indication of the relative strength of the U.S. economy over time.

Site Data

This site is primarily powered by:

This page is powered by Blogger. Isn't yours?

Visitors since December 6, 2004:

CSS Validation

Valid CSS!

RSS Site Feed

AddThis Feed Button

JavaScript

The tools on this site are built using JavaScript. If you would like to learn more, one of the best free resources on the web is available at W3Schools.com.

Other Cool Resources

ZunZun - Exceptional regression analysis tool.
Wolfram Integrator - Solve integrals. Do calculus!
Create a Graph - Easy-to-use basic graph-making tool.
Many Eyes - Data visualization extraordinaire!
Wolfram Alpha - Computational knowledge engine.
Khan Academy - Math & science video mini-lectures!
Picasion - Animate images.


Archives
December 2004
January 2005
February 2005
March 2005
April 2005
May 2005
June 2005
July 2005
August 2005
September 2005
October 2005
November 2005
December 2005
January 2006
February 2006
March 2006
April 2006
May 2006
June 2006
July 2006
August 2006
September 2006
October 2006
November 2006
December 2006
January 2007
February 2007
March 2007
April 2007
May 2007
June 2007
July 2007
August 2007
September 2007
October 2007
November 2007
December 2007
January 2008
February 2008
March 2008
April 2008
May 2008
June 2008
July 2008
August 2008
September 2008
October 2008
November 2008
December 2008
January 2009
February 2009
March 2009
April 2009
May 2009
June 2009
July 2009
August 2009
September 2009
October 2009
November 2009
December 2009
January 2010
February 2010
March 2010
April 2010
May 2010
June 2010
July 2010
August 2010
September 2010
October 2010
November 2010
December 2010
January 2011
February 2011
March 2011
April 2011
May 2011
June 2011
July 2011
August 2011
September 2011
October 2011
November 2011
December 2011
January 2012
February 2012
March 2012
April 2012
May 2012
June 2012
July 2012
August 2012
September 2012
October 2012
November 2012
December 2012
January 2013
February 2013
March 2013
April 2013
May 2013

Blog Roll

Bloodhoundblog
Budgets Are Sexy
Cafe Hayek
Carpe Diem
Core77
Coyote Blog
Craig Harper
Darwin's Finance
Digerati Life, The
Division of Labour
Dough Roller, The
Eclectecon
Econlog
Economics Roundtable
EconomicsUK
Environmental Economics
Escape from Cubicle Nation
Execupundit
FiscalGeek
Get Rich Slowly
Gongol
Good Financial Cents
HR Bartender
Hot Air
i4cp Productivity
Innocent Bystanders
Innovation and Growth
Instapundit
Intangible Economy
I've Paid Twice for This Already
Joanne Jacobs
Kaus Files
Len Penzo dot Com
Making Ripples
Market Power
Mechonomics
Mighty Bargain Hunter
Monevator
My Dollar Plan
New Economist
Newmark's Door
Nina Simosko
Physorg
Private Sector Development
Real Clear Politics
Richard Fernandez
Roger L. Simon
Rowan Manahan
Sound Politics
SOX First
Sports Economist, The
squawkfox
Three Star Leadership
Tim Worstall
Townhall
Trusted Advisor
Uncommon Misperceptions
voluntaryXchange
WILLisms
Winterspeak

Market Links

Big Picture, The
Crackerjack Finance
CXO Advisory Group
Disciplined Approach to Investing
Dividend Guy, The
Doug Short
Evidence Investing
Fat Pitch Financials
FX Investment Strategies
Oilprice

Charities We Support

American Red Cross
Children's Heart Foundation
Salvation Army
SMA Foundation

Recommended Reading

Kindle Paperwhite 3G - Best e-reader!
Angel in the Whirlwind
Bailout Nation
Cartoon Guide to Statistics
A Comprehensive Guide to the Peloponnesian War
The Complete Personal Memoirs of Ulysses S. Grant
The Count of Monte Cristo
Ender's Game
Gardner's Art Through the Ages
Empire of Wealth
How to Make Presentations to Councils and Boards
Juran's Quality Handbook
Marks' Standard Handbook
The Second World War
Stocks for the Long Run
Why Smart Executives Fail

Recommended Viewing

The Tudors: The Complete Series

Recently Shopped

Kindle Fire HD 8.9" 4G LTE Wireless 32 GB
Snap Circuits Jr. SC-100
Nerf Vortex Praxis
Sony BRAVIA 40" LED HDTV
2540 Series Docking Station
New Balance MX623
Dunham Men's Waterproof Oxford
TN360 Black Toner Cartridge
The Dangerous Book for Boys
Air Swimmer Remote Control Inflatable Flying Shark
Fisher-Price Little People Lil Pirate Ship

Seeking Alpha Certified