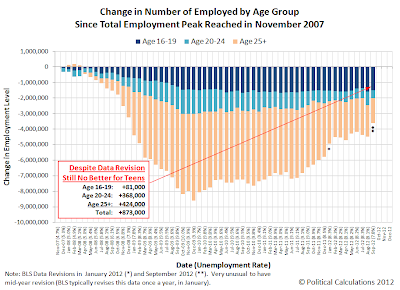
The big news with the September 2012 employment situation report is that it added 873,000 people to the count of the number of employed individuals in the U.S. thanks to an unexpected adjustment in the BLS' monthly count. Here's how that breaks down in the month-over-month change in the number of employed Americans by age group:
- Age 16-19: +80,000 (now totaling 4,425,000)
- Age 20-24: +368,000 (now totaling 13,482,000)
- Age 25+: +424,000 (now totaling 125,067,000)
Overall, some 142,974,000 Americans are now being counted as having jobs.
Approximately two-thirds of the month-over-month increase of 873,000 are accounted for by individuals working part time, as the BLS added some 582,000 part time workers to its count that it had previously been missing in its monthly totals.
Looking at the change in the number of employed by age group since total employment peaked in November 2007, just ahead of the recession, we find that teens are still in the basement, with their numbers in the U.S. work force reduced by just over 1.5 million. Meanwhile, we see that 519,000 fewer young adults in the age range from 20 to 24 years old are being counted as being employed today compared to that point nearly five years ago.
There are 1.6 million fewer adults Age 25 and older working today than in November 2007.
Perhaps then the most surprising outcome of the BLS' unexpected adjustment to its reported data is that it continues to show that there has been no meaningful improvement in the employment situation for U.S. teens since October 2009.
An Unexpected Adjustment
On a side note, we've been following the BLS' monthly employment situation report for several years now, and the household survey portion of it in particular. In our experience, it's a pretty stable source of data, in that it isn't revised anywhere near as often as is the data collected through the payroll survey portion of the report. Instead, over the last several years, it has only gone through major adjustments once per year, which has been covered in the employment situation report for January of each year.
So we were surprised that the BLS opted to incorporate such a major adjustment in its reported figures for the household survey for the second time this year. Just three months before we would have expected such a revision to be made. We wonder why they chose now to put forward this adjustment, rather than continuing to follow their practice of many years of only making adjustments once per year....
Labels: jobs
Welcome to the blogosphere's toolchest! Here, unlike other blogs dedicated to analyzing current events, we create easy-to-use, simple tools to do the math related to them so you can get in on the action too! If you would like to learn more about these tools, or if you would like to contribute ideas to develop for this blog, please e-mail us at:
ironman at politicalcalculations
Thanks in advance!
Closing values for previous trading day.
This site is primarily powered by:
CSS Validation
RSS Site Feed
JavaScript
The tools on this site are built using JavaScript. If you would like to learn more, one of the best free resources on the web is available at W3Schools.com.
