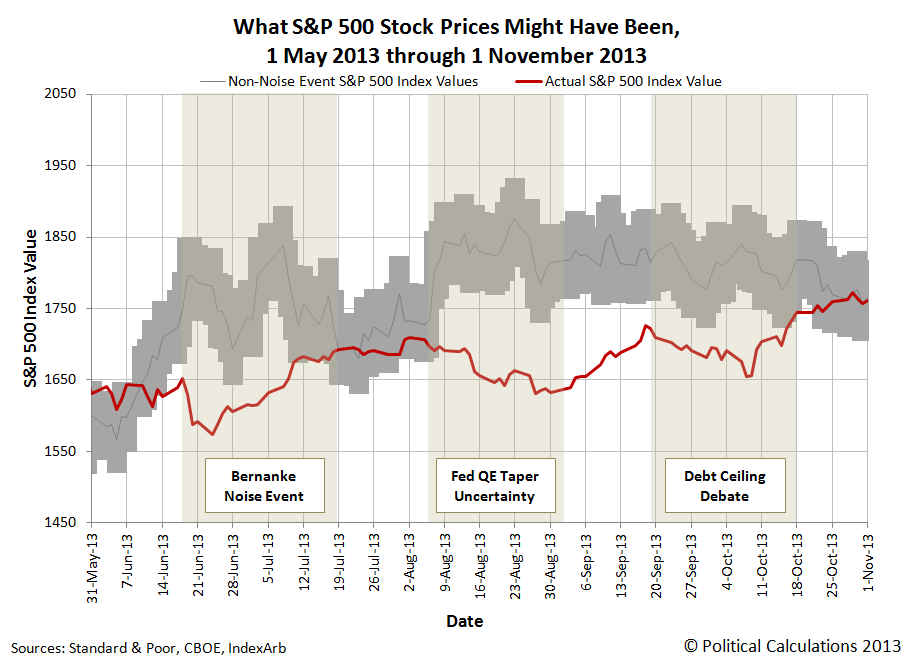
How would stock prices have behaved during the summer and fall of 2013 if the stock market didn't have such large noise events to contend with during that period of time?
Normally, we concern ourselves with the alternate futures where stock prices are concerned, but today, we're looking in the rear-view mirror because that's the natural question that arises from a casual throwaway line in our 4 November 2013 review of the previous week's S&P 500's performance.
So to answer that question, we thought we might visualize just what that alternative past would have looked like! Our results are presented in the chart below:
Here, we've taken our dividend futures data for 2014-Q1, which would appear to be where investors have collectively focused their forward-looking attention since early May 2013, and used it with our math linking dividends and stock prices to see what stock prices would have been if investors had not been distracted by those huge noise events.
Now, that doesn't mean that there wouldn't have been any noise at all in the stock market. With so many trading transactions and minor news events each day, stock prices would still bounce around their target level quite a bit. In the chart above, we've shown that "typical" level of noise as being within a plus-or-minus 3% range of our 2014-Q1 dividend futures target level for the S&P 500's index value.
The really odd thing is that stock prices have largely gotten to where they would otherwise have been despite the negative effect of all these big noise events - and that's what we mean when we say that all noise events end - it's only ever a question of when.
Welcome to the blogosphere's toolchest! Here, unlike other blogs dedicated to analyzing current events, we create easy-to-use, simple tools to do the math related to them so you can get in on the action too! If you would like to learn more about these tools, or if you would like to contribute ideas to develop for this blog, please e-mail us at:
ironman at politicalcalculations
Thanks in advance!
Closing values for previous trading day.
This site is primarily powered by:
CSS Validation
RSS Site Feed
JavaScript
The tools on this site are built using JavaScript. If you would like to learn more, one of the best free resources on the web is available at W3Schools.com.
