How much do events in the past drive stock prices today?
Last week, we took advantage of a natural experiment with the stock market to find out (not to be confused with the somewhat larger "experiment" we described previously, where we have subsequently been cleared of any mal-intent thanks to an investigation by the Financial Investment Regulatory Authority. Really - it was the satisfying conclusion to the most successful April Fools' prank we've executed to date!)
Here though, the events that set up the experiment occurred both one year and one month earlier, just as it did a month earlier in what we described as an aftershock event for the S&P 500. As you recall, our model of how stock prices behave anticipated the aftershock event of 10-11 April 2014 weeks before its arrival - the chart below shows what our model was projecting as of 28 March 2014:
Let's flash forward to last week, when we very uncharacteristically offered very little comment about the week as we focused instead upon setting up a proper state of nervous anxiety as we showed what our model was projecting as of 2 May 2014:

Comparing the projected future between these two charts, we see that prior to the arrival of the 10-11 April 2014 aftershock event, our model really only saw somewhat of a modest downturn covering the period from 9 May through 12 May 2014. But after the aftershock, our model, which incorporates the stock prices of one month ago and one year ago as key base reference points for making its projections of the future, shifted to indicate a sharper decline in stock prices, as the ripples of the previous aftershock event rippled forward in time.
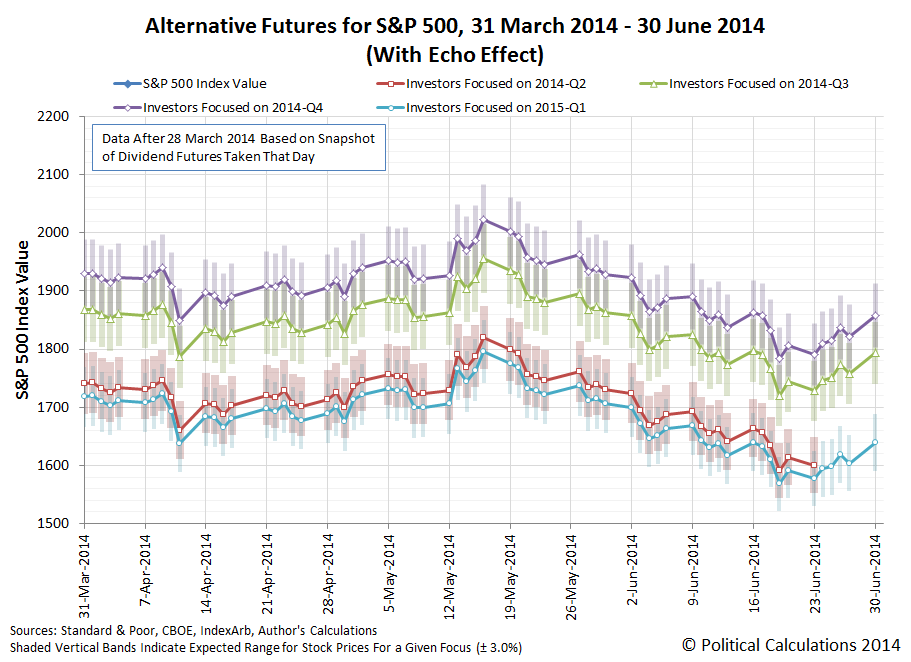
Let's now look at the latest version of our alternative futures chart, showing what it projects as of 9 May 2014:

Clearly it's not playing out that way. Instead of an aftershock, our model is really projecting an echo. Noise from the past.
But wait - didn't we go to quite a lot of trouble to develop a method for filtering out that kind of thing from our model?
We did, but we only filtered the echoes from a year earlier in time - not the echoes from a month ago. We didn't make any adjustment for the echo effect in the short term, choosing instead to accept a larger degree of error in our projections than we might otherwise, which you see in our charts as the shaded vertical bars shown with respect to the midpoint of the likely range our model anticipates for stock prices for each of the alternative futures investors might focus upon as they set today's stock prices.
But should we account for the short-term echo effect? In our analysis of the 10-11 April 2014 aftershock event, we recognized a number of factors where events in the past could indeed create the potential for the outcomes we observe in the present to occur. If we filtered out the short term echo effect, our model might miss those episodes.
The answer then to the question we asked at the beginning of this post is that the degree to which events in the past might drive today's aftershocks or dissipate as yesterday's echoes would really appear to depend greatly upon what investors expect for the future as the maturity and option expiration dates associated with their previous investment choices come to pass and provide the means for executing new decisions.
And perhaps the best we can do in forecasting the future as these echoes develop into aftershocks or not is to simply acknowledge when a state of nervous anxiety on the part of investors is appropriate.
Welcome to the blogosphere's toolchest! Here, unlike other blogs dedicated to analyzing current events, we create easy-to-use, simple tools to do the math related to them so you can get in on the action too! If you would like to learn more about these tools, or if you would like to contribute ideas to develop for this blog, please e-mail us at:
ironman at politicalcalculations
Thanks in advance!
Closing values for previous trading day.
This site is primarily powered by:
CSS Validation

RSS Site Feed
JavaScript
The tools on this site are built using JavaScript. If you would like to learn more, one of the best free resources on the web is available at W3Schools.com.
Other Cool Resources
Blog Roll


