Since April 2015, while the estimated trailing year average median household income of Americans has increased by roughly $500, the median sale prices of new homes in the United States has essentially moved sideways - holding level at a trailing year average of roughly $290,000.
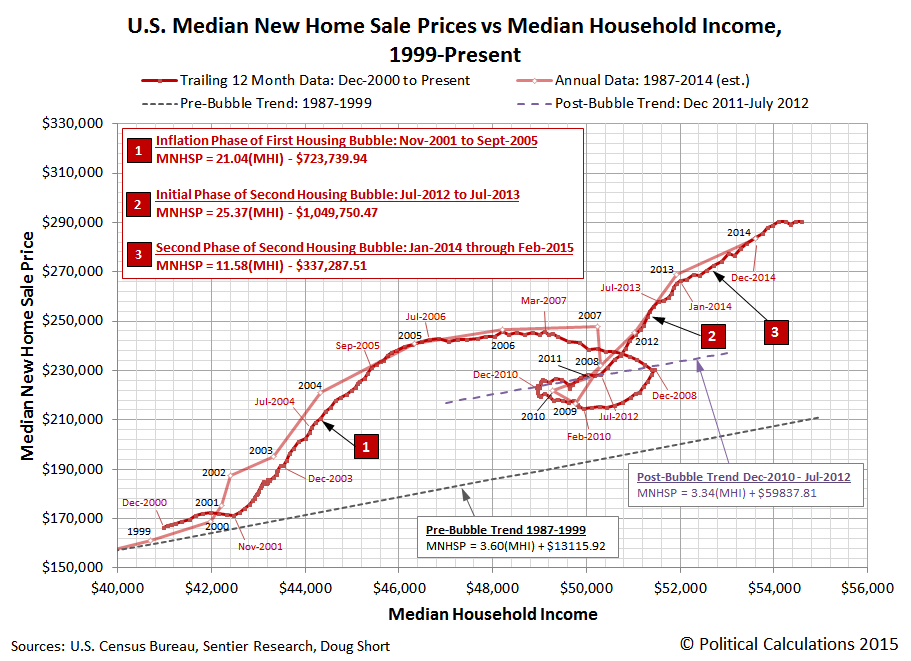
While that combination indicates that new homes are becoming relatively more affordable for the typical American household, we can't also help but notice how similar the current trend is to the nine month-long period from July 2006 through March 2007, which saw the final topping of the first U.S. housing bubble before it fully entered into its deflation phase.
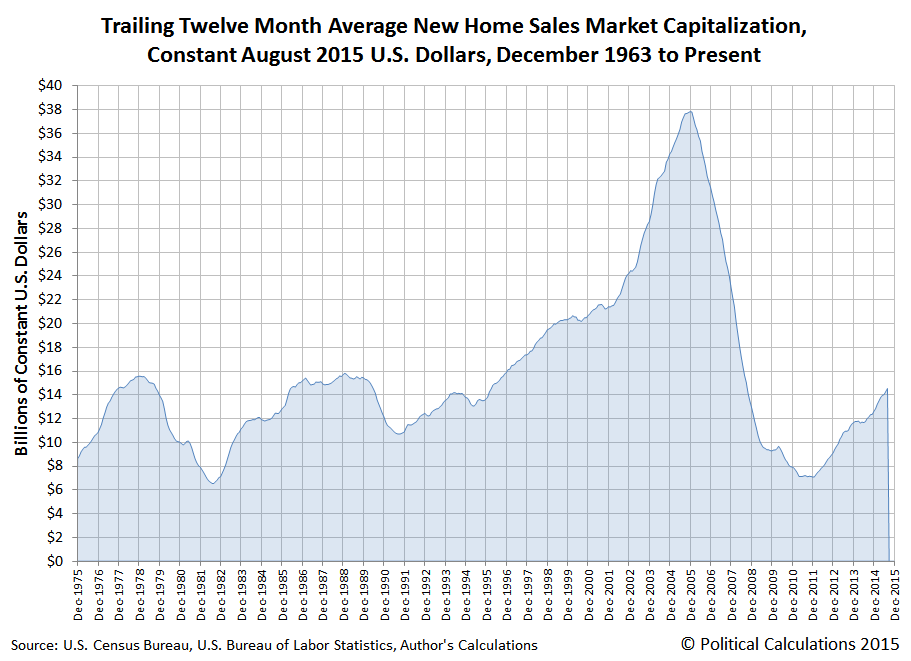
Unlike that period however, the number of sales of new homes in the U.S. is currently rising - not falling. The chart below shows our calculation of the effective market capitalization of the total U.S. new home market, as adjusted for inflation to be in terms of constant August 2015 U.S. dollars.
So from that perspective, it's completely different! And considering how elevated median new home sale prices are with respect to the long term relationship between median household income, that those prices are moving sideways actually represents a positive development for the very slowly recovering U.S. real estate market.
Labels: real estate
Welcome to the blogosphere's toolchest! Here, unlike other blogs dedicated to analyzing current events, we create easy-to-use, simple tools to do the math related to them so you can get in on the action too! If you would like to learn more about these tools, or if you would like to contribute ideas to develop for this blog, please e-mail us at:
ironman at politicalcalculations
Thanks in advance!
Closing values for previous trading day.
This site is primarily powered by:
CSS Validation

RSS Site Feed
JavaScript
The tools on this site are built using JavaScript. If you would like to learn more, one of the best free resources on the web is available at W3Schools.com.
Other Cool Resources
Blog Roll


