The United States has a curious relationship with the price of oil and gasoline. For much of the U.S., falling fuel prices represent a positive economic situation, which gives Americans the opportunity to spend their disposable income on things other than fuel, such as dining out, clothes, and cars. And yes, even more fuel (for leisure travel).
These are the kinds of oil price-sensitive industries that can grow and expand when oil prices fall, which because these kinds of businesses are found in every state, means that American consumers benefit in every state from that dynamic.
In some states however, whose economies include significant contributions from oil production, falling oil prices can have a negative consequence as well. As revenues and profits in the oil producing sector of their economies fall, the benefits of falling oil prices for consumers is offset by losses in the productive part of their economies.
That's something that becomes especially clear when we look at statistics like new jobless claims. If we look across the nation, we see that there has been a general trend of improvement in the level of initial unemployment insurance claims filed each week since oil prices began falling from their peaks in early July 2014.

But now, if we focus on the eight states that have significant, but high cost oil production that is really only profitable when oil prices are high, we find that the number of new jobless claims has risen and fallen inversely with the national average price of gasoline.
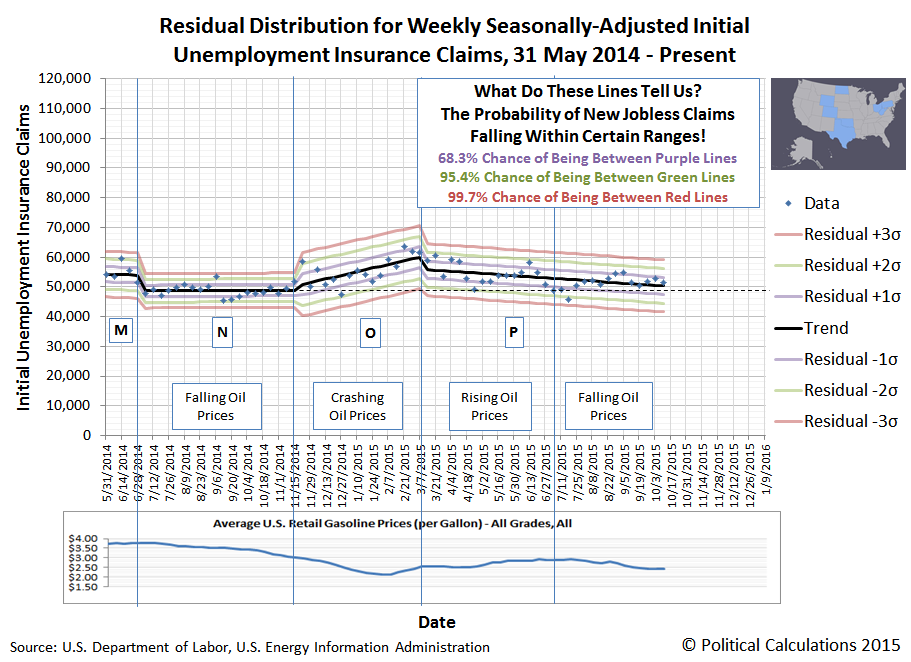
At present, we find that the seasonally-adjusted level of new jobless claims for the states of Colorado, North Dakota, Ohio, Oklahoma, Pennsylvania, Texas, West Virginia and Wyoming is essentially the same as it was before oil prices began falling. In these states, for new jobless claims, the positive economic benefits of falling oil and gasoline prices for consumers has been almost perfectly offset at this point of time by increased new jobless claims taking place in their oil production sectors.
That state of affairs then makes it possible for us to easily estimate just how many oil-related layoffs leading to new jobless claims have been taking place in these states compared to the 42 others. The chart below shows the trend for new jobless claims in all these other states:
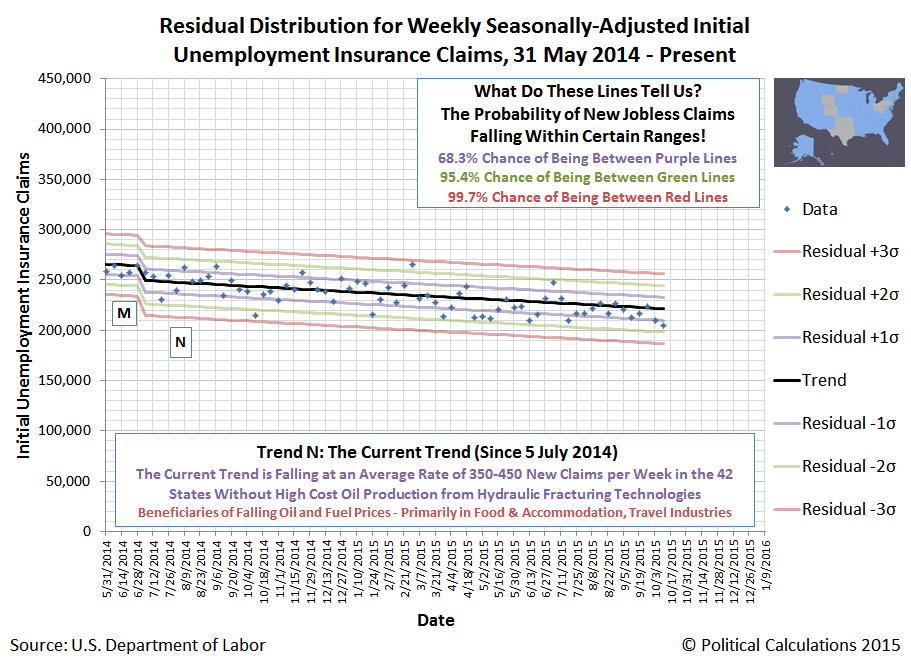
In these 42 states, since 5 July 2014, the number of new jobless claims has been falling at an average rate of 424 claims per week. Meanwhile, as we previously noted, the overall trend in new jobless claims for the 8 high-cost oil-producing states since 5 July 2014 is essentially flat.
If we assume then that the other economic sectors of these eight states would be seeing the same benefits from falling oil and gasoline prices that are being realized in the other 42 states, we would therefore estimate that these states have lost, on average, about 424 jobs per week in each week since 5 July 2014, where the people laid off subsequently acted to apply for unemployment benefits.
That number could be a lot higher, but isn't, because there are other industries in these states that are still hiring, which pay better wages than the alternative of unemployment benefits.
Still, over the 67 weeks since oil prices began falling after 5 July 2014, that 424 per week figure would represent a total of 28,408 Americans who couldn't find a better paying alternative for unemployment benefits in these states.
Labels: jobs
Welcome to the blogosphere's toolchest! Here, unlike other blogs dedicated to analyzing current events, we create easy-to-use, simple tools to do the math related to them so you can get in on the action too! If you would like to learn more about these tools, or if you would like to contribute ideas to develop for this blog, please e-mail us at:
ironman at politicalcalculations
Thanks in advance!
Closing values for previous trading day.
This site is primarily powered by:
CSS Validation

RSS Site Feed
JavaScript
The tools on this site are built using JavaScript. If you would like to learn more, one of the best free resources on the web is available at W3Schools.com.
Other Cool Resources
Blog Roll


